Debugging Browser Console Errors
The migration process makes heavy use of both AJAX and JavaScript and can sometimes report errors in your browser’s debugging console. While the new user interface will report these errors in the migration overview screen, it’s often useful to debug the error in more detail. This guide will show you how to identify these errors in your browser console.
Firefox
- Open the Firefox developer tools (F12 / ⌘-Option-I)
- Click the Console button
- Click the bin icon to clear the current console before attempting a migration
- Make sure that Errors and Requests options are enabled

Chrome
- Open the Chrome developer tools (F12 / ⌘-Option-I)
- Click the Console tab
- Click the Clear console icon to clear the current console before attempting a migration
- Ensure that the logging levels are set to at least “Default levels”

Error Example
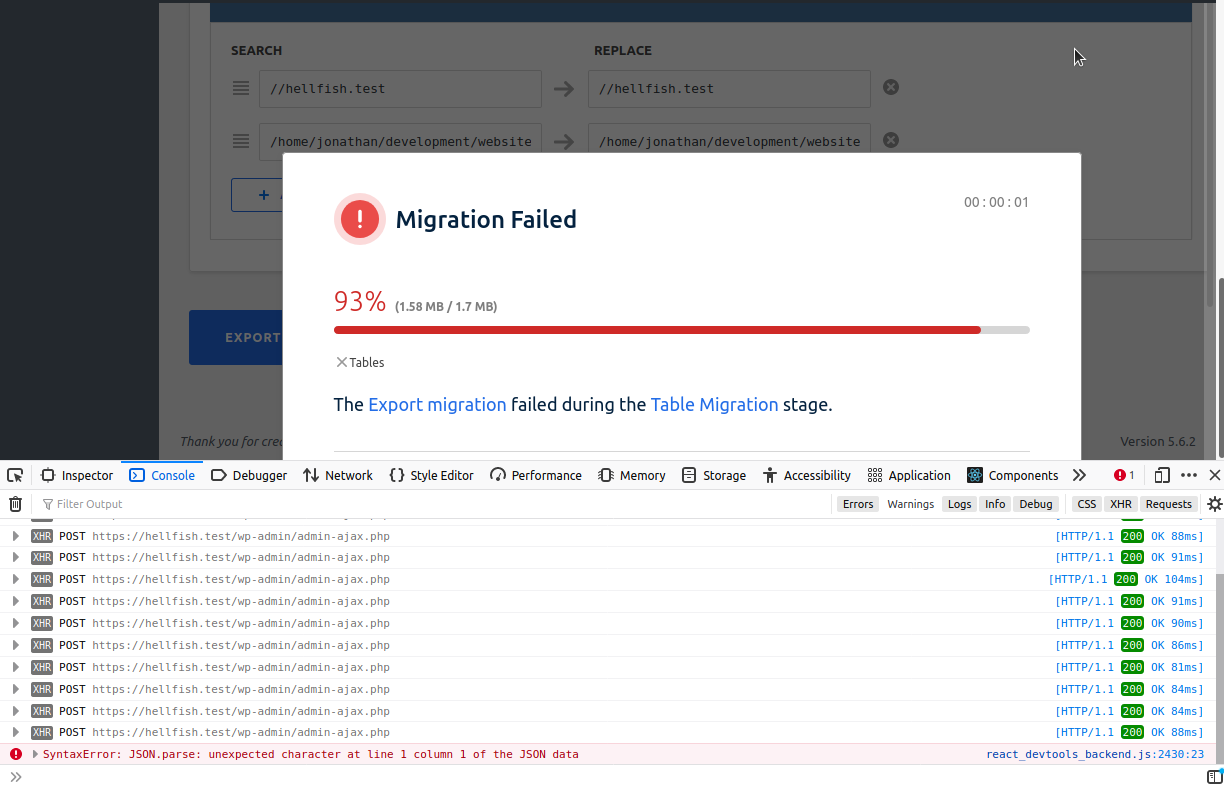
This is an example of an error occurring in WP Migrate DB Pro in Firefox. Developer tools are open, and we’re able to see additional debugging information.


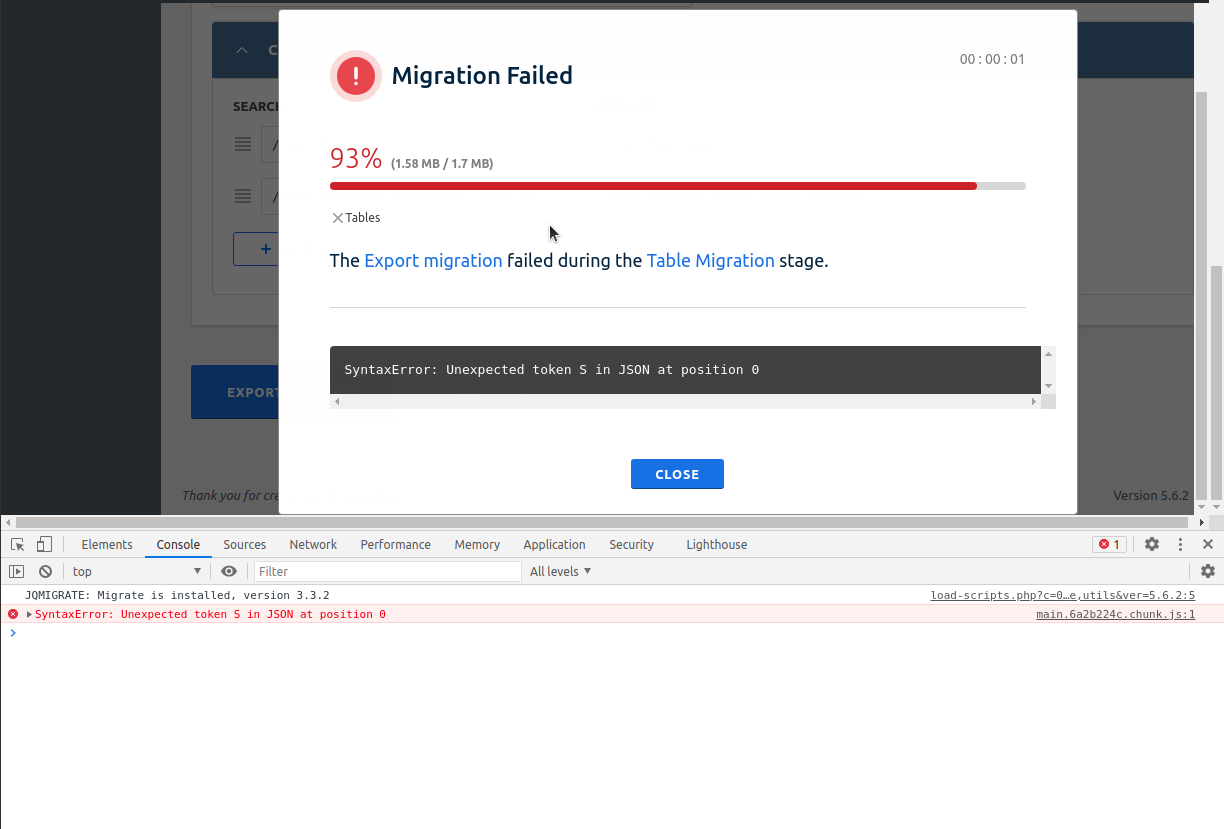
Below is the same error, but instead demonstrated in Chrome developer tools.

In both browsers you can click on the troublesome request in the console to see more information. It may also be useful to check on the Network tab, to view the request and response data for each request.
WP Migrate DB Pro version 1.x
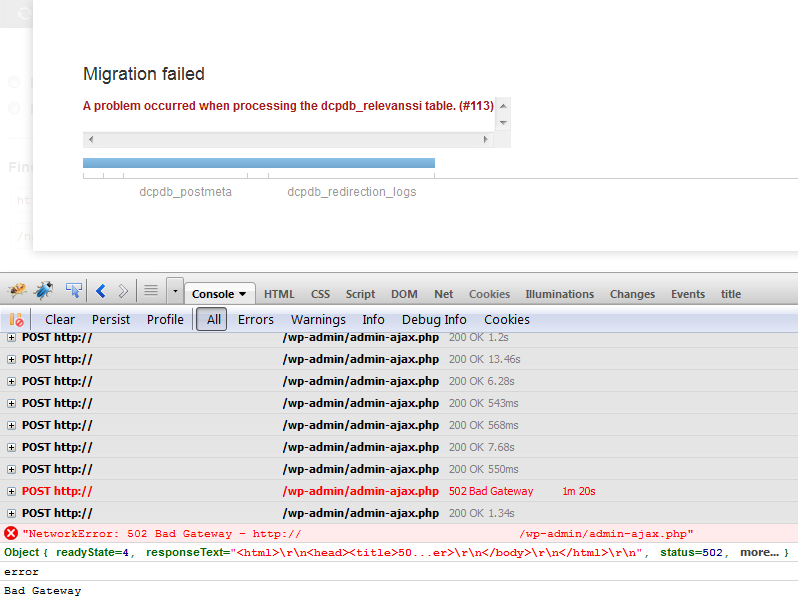
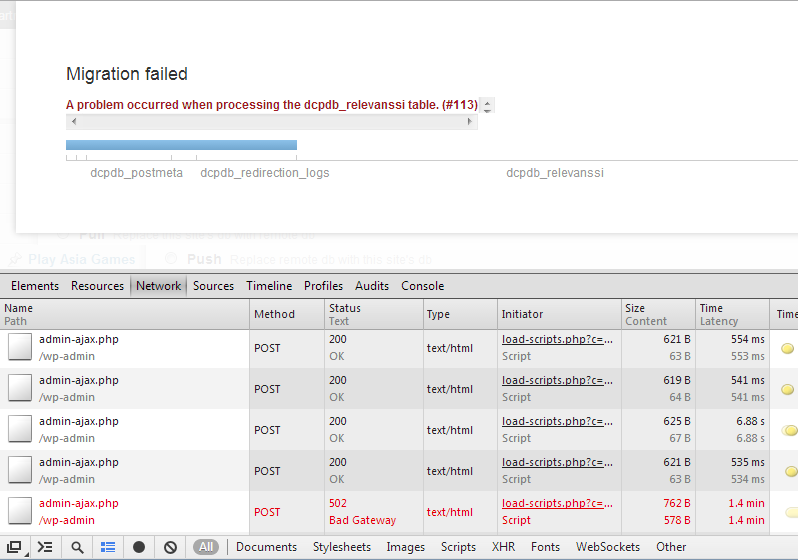
The images below are what a similar error would look like in WP Migrate DB versions older than 2.0, in both Firefox and Chrome.

