
We just hit a huge milestone in our Mergebot beta by lifting the 1,000 queries per deployment limit 🎉. We created Mergebot to make merging WordPress databases easy. When we were building Mergebot, the problems we were focused on solving were so complex that we didn’t really spend much time thinking about optimization or making our code run quickly. However, it became clear that we needed to do something about the performance of the app, especially the performance of our deployment generation jobs, to be able to lift the 1,000 queries per deployment limitation.
As part of my work on lifting the limit, I needed to ensure that deployments wouldn’t just fail because of timeouts or hitting memory limits. Enter, Laravel.
As you probably know by now, the Mergebot application is built using Laravel. We use Laravel’s Queue Jobs to handle any long-running processes (e.g. generating a deployment) so that the workload can be offloaded from the web server and scaled separately.
My first port of call when it comes to profiling PHP applications is Blackfire. Blackfire’s premium plans offer all sorts of fancy performance monitoring features, which are definitely worth checking out, but their free plan allows you to profile web pages, CLI scripts, and API Calls allowing you to measure wall time and memory usage. This is more than enough to get you going when you need to look for performance bottlenecks in PHP code.
In this article, we’re going to look at how to profile a Laravel application and specifically how I profile a queue job using Blackfire. We will have a look at how we should interpret the results and see how I managed to improve the performance of Mergebot by 1200%.
Laravel and Blackfire
The first thing we need to do is get Blackfire up and running on the server that is running our Laravel app. For the purposes of this tutorial, we’re going to use a Laravel Homestead VM, but these instructions would apply for any server that you run your Laravel app on.
If you haven’t done so already, head on over and sign up for a Blackfire account. Once logged in, navigate to the account page where you should see your client credentials. You will need this information shortly.
I’m going to assume you have your Laravel app already set up on Homestead (or your server). Homestead saves us a bit of time by coming with Blackfire pre-installed, but if you don’t have Blackfire installed yet then simply follow the instructions from the Blackfire docs (we need the agent, the CLI tool, and the PHP probe all to be installed).
We can test our Blackfire installation by profiling a built-in Artisan command. SSH to Homestead then run the following from the root of your app:
blackfire run php artisan route:list
If this is the first time you’ve run Blackfire you will probably see an error about “Blackfire isn’t configured correctly”. If this is the case then run blackfire config, following the instructions and using the information provided from the account page in the Blackfire dashboard. Once that is done, run the above command again. Hopefully, you should see something like this:

If we visit the Graph URL (or just head to the Blackfire Dashboard) you should see the results in the list of profiles.
Profiling Jobs using Commands
Next, we’re going to create an Artisan command to test our job class. If you already have a job class you want to test, feel free to use it. Otherwise, we can create a dummy job to use for testing purposes. To do this, run the following:
php artisan make:job DummyJob
You should now see a DummyJob class in the app/Jobs directory of your Laravel app. Normally to run this job you would need to set up a queue worker, dispatch the job and then wait till it was picked up and executed by the queue listener. However, this process isn’t going to help us much when it comes to profiling the code that is run while the job is being executed. Instead, I like to create an Artisan Command specifically for executing the job so we can run it using the CLI. Let’s go ahead and create the command:
php artisan make:command ExecuteDummyJob
This will create an ExecuteDummyJob class in the app/Console/Commands directory. There are two changes we need to make to this class. First, give the command a proper signature:
protected $signature = 'app:execute-dummy-job';
Second, we need to execute the handle method of our DummyJob class (this is what the queue worker would normally do):
use App\Jobs\DummyJob;

/**
 * Execute the console command.
 *
 * @return mixed
 */
public function handle()
{
    $job = new DummyJob();
    $job->handle();
}
Finally, remember to add our new command to the Kernel.php class so that we can run it:
/**
 * The Artisan commands provided by your application.
 *
 * @var array
 */
protected $commands = [
    \App\Console\Commands\ExecuteDummyJob::class,
];
Now if we run php artisan app:execute-dummy-job we are basically replicating what would be executed by the queue listener, except that now we can profile it using the Blackfire CLI:
blackfire run php artisan app:execute-dummy-job
Interpreting Blackfire Results
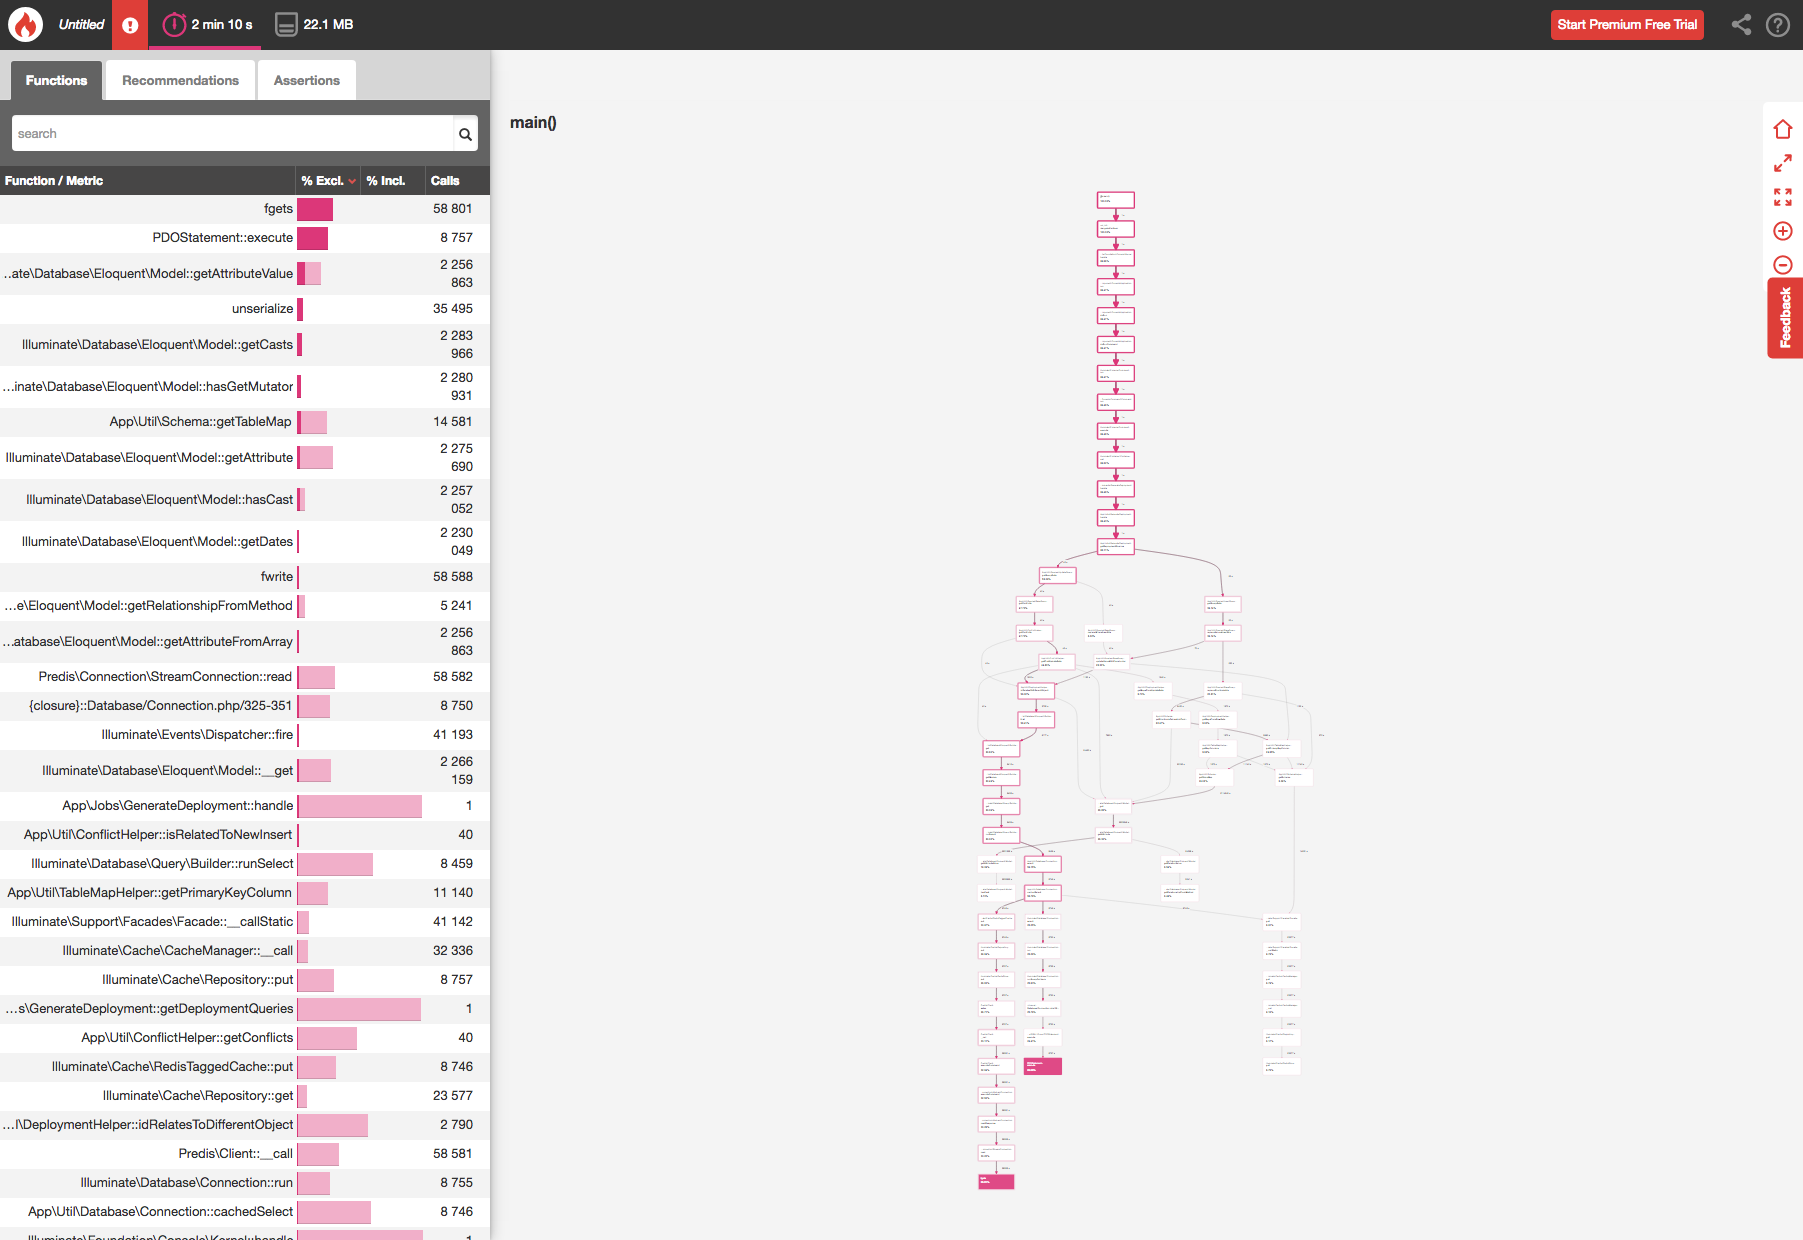
For this section, I’m actually going to look at a real world example from Mergebot, but if you’ve got your own job, or you’ve just set up the DummyJob and added some code to profile, you can use that as the basis for investigating your results. Here are the results from running a 60 query deployment on the old Mergebot code:
The first thing I’d recommend doing before jumping into these results is to read Blackfire’s own docs on Analyzing Profiles. This should give you a decent understanding of how the Blackfire results page works.
Next, you should notice the main result metrics for this profile: it took 2 mins 10 secs to run using 22.1 MB of memory. These are going to be the main performance indicators that we are trying to reduce.

In the main call graph, we can see the flow of the code execution including how many times each method was called and where the “hot path” leads (where most of the execution time was spent). The Blackfire docs recommend always analyzing the hot path first to see if it is being caused by an obvious bottleneck, but be aware that sometimes the hot path is entirely justified and not actually an issue.
In this case, the two hot paths lead to fgets (reading from the cache) and PDOStatement::execute (executing database queries).

This doesn’t tell us much on its own. However, notice how often each of these methods is being called. Reading from the cache (fgets) is being called more than 58,000 times, and there are more than 8,500 database queries being executed, all for a 60 query deployment! No wonder we are having performance issues. Let’s head back up the call graph and see if we can identify where the issue is arising.

Ah, now we can see where there is a clear performance bottleneck. The idRelatesToDifferentObject method was called 2790 times, mainly from the getFirstUpdateData and updateValueWithPlaceholder methods. This means that these methods are probably calling idRelatesToDifferentObject inside a loop that is happening way more often than anticipated. We’ve just found the location of a performance bottleneck that we can start refactoring.
This same process can be repeated as often as you need until you are happy with the performance of your code. Blackfire has another neat feature that lets you compare profiles to see the performance improvement. Let’s compare this profile to the new, re-written, deployment process code that I wrote for Mergebot.
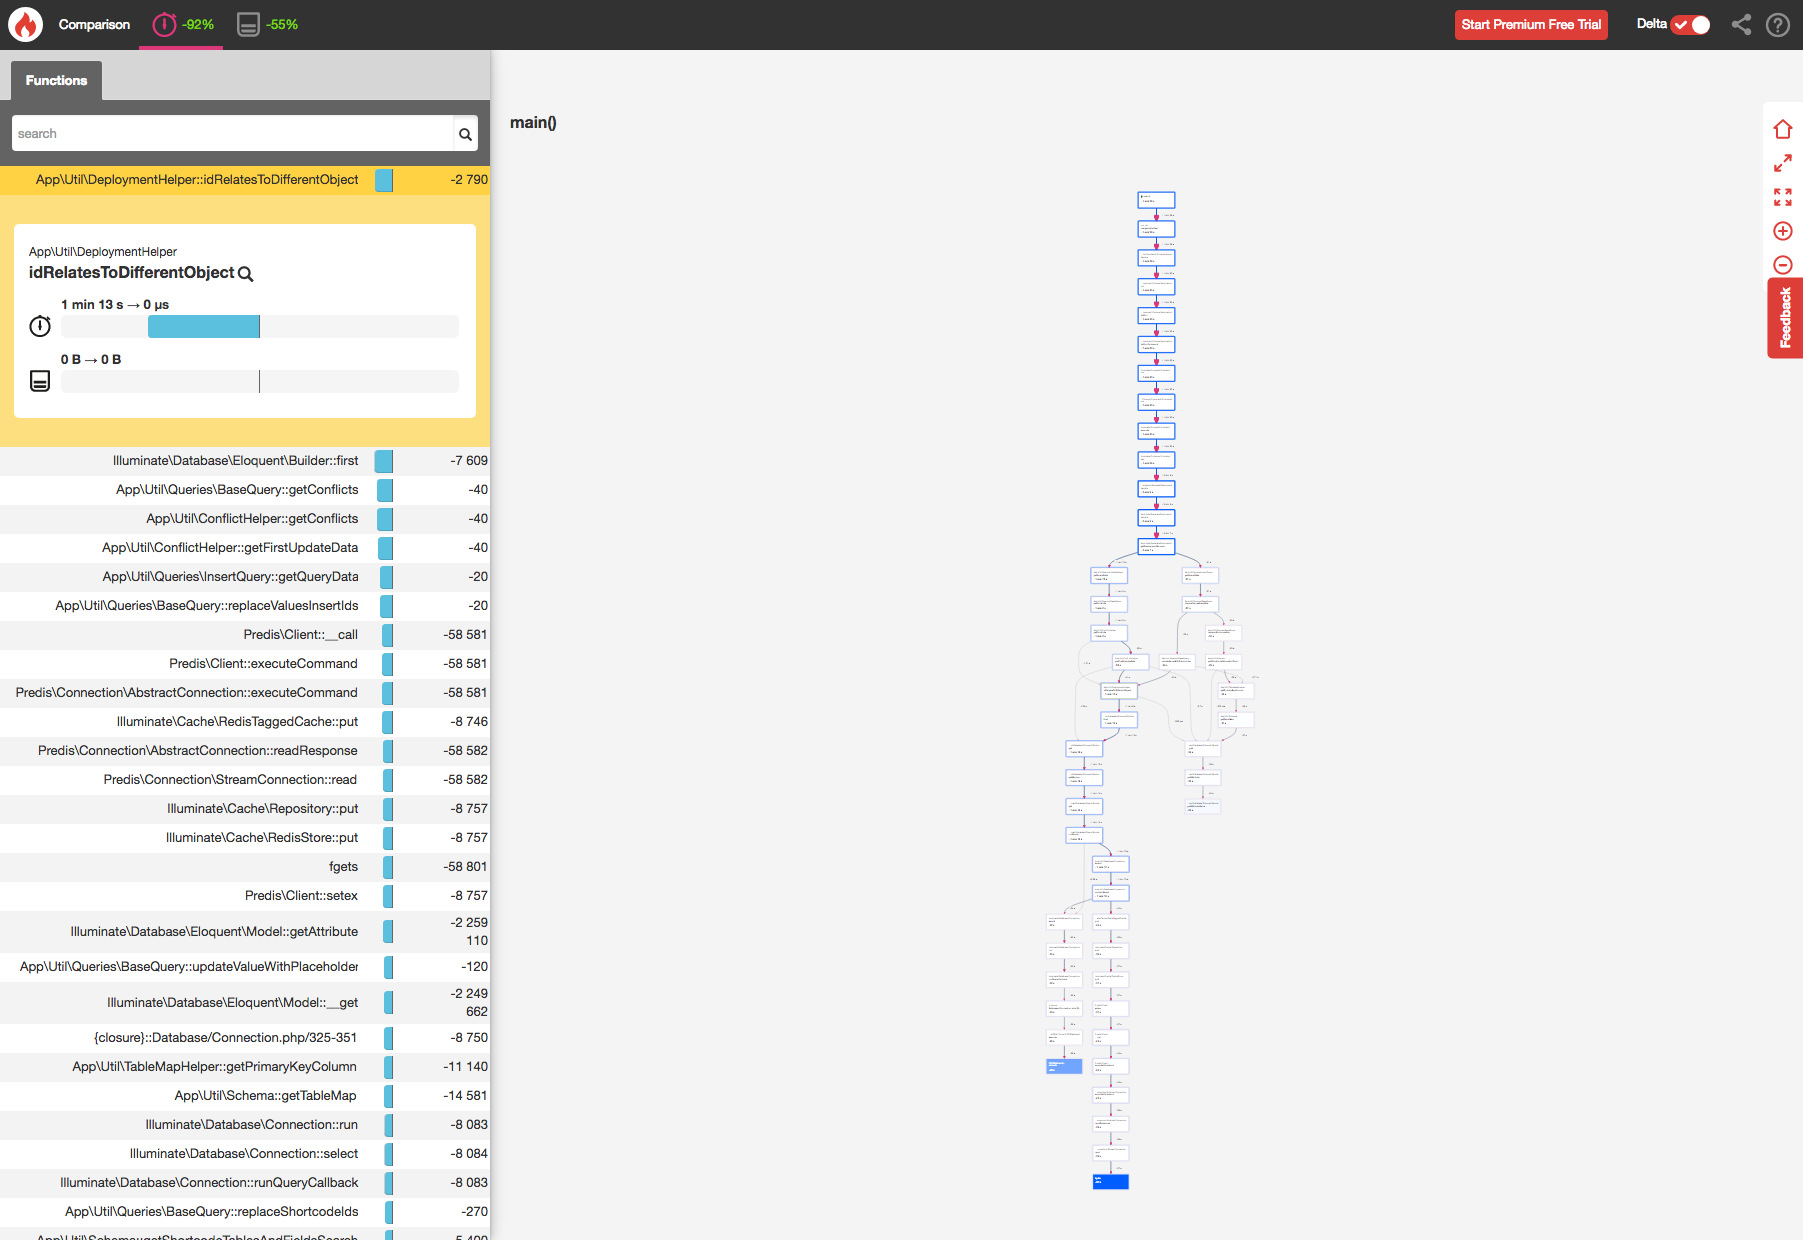
The first thing to notice is the performance improvement of the main time and memory metrics:

Great Scott! This code runs in 8% of the time (that’s 1200% quicker than before) and uses less than half the memory. The same 60 query deployment now takes just 10 seconds. Not bad. Let’s look at the hot path for the new code.
The hot path still leads to the same types of event (reading from the cache and executing database queries). However, notice that we’re calling these methods much less than before. PDOStatement::execute went from being called 8700 times to 674 times. Limiting database queries is an effective way to improve performance.
If we head back up the call graph let’s see what happened to our method calls.

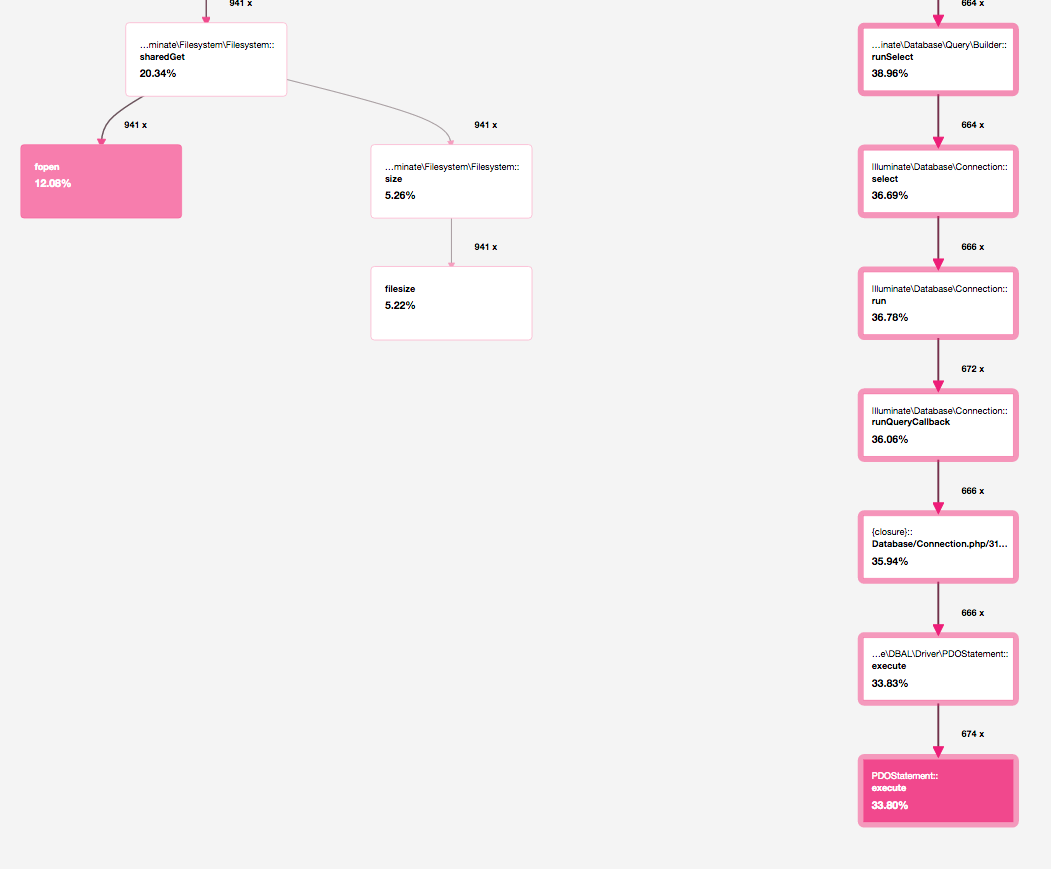
The idRelatesToDifferentObject method has gone from being called 2790 times to 940 times. This is a decent improvement in itself, but it also has a knock-on effect on the number of times any methods are being called within the idRelatesToDifferentObject method. If we look at this in the comparison graph we can see the effect this has on the time of the execution.

Improving Your App’s Performance
Hopefully, by this point, you’ve managed to get Blackfire set up on your Laravel install and are able to create profiles to benchmark your code. The process we used for creating an Artisan command to test queue jobs on the CLI can, in theory, be used to test any part of your code that you may want to profile.
In the Mergebot example, the main cause of the performance bottleneck was because we were calling code within loops a lot more than anticipated. This actually caused an exponential performance issue that made large deployments break completely. The simple solution to this type of performance issue is to refactor your code to call the methods less often. However, there are many different types of issues that may cause your code to run slowly and each project will face its own unique performance challenges.
What’s next for Mergebot? In the coming weeks, we’re hoping to launch another often requested feature: multisite support.
Have you ever used Blackfire to profile your code before? Do you have any tips on optimizing Laravel/PHP code? What performance issues have you run into in the past? Let us know in the comments.
If you want to have first dibs on the next round of seats for Mergebot, make sure you sign up here.
Update: If you want to go a bit further testing queue jobs you might be interested in a new project I just released. Sqsd is a replica of the AWS Elastic Beanstalk worker SQS daemon (sqsd) for testing how your app handles queue jobs the “AWS way”.