


Ever since I discovered how to configure PhpStorm with Xdebug for debugging, it’s been my go-to solution for hunting down difficult to reproduce bugs. What I didn’t know until very recently was that it’s also possible to debug JavaScript using the same setup, which blew my mind!

PHP is a backend language, and JavaScript is (for me) a frontend language. How is this magic even possible? In this article, I’ll show you how it works, how to use it to debug JavaScript and PHP code at the same time, and how you can debug modern JavaScript frameworks like React or Vue.
Why Use the PhpStorm Debugger?
Built by JetBrains, PhpStorm is in my opinion — and the opinion of many of my colleagues — the best IDE for PHP development. PhpStorm supports advanced Xdebug features like remote debugging, but one of my favorite features is the zero-configuration debugging setup. It reminds me of my Delphi/Visual Basic days when the development IDE had a built-in step debugger you could turn on by setting a few breakpoints and running the application code.
PhpStorm also ships with a JavaScript debugger, which is just as straightforward to set up and use. One of the biggest advantages of setting this up alongside the PHP debugger is that it’s possible to debug both JavaScript and PHP during the same session!
You’ll know how painful this can be if you’ve ever had to debug a WordPress asynchronous request handled by either admin-ajax.php or the WP REST API. First, you have to rule out if the issue lies with JavaScript. You could try adding a console.log() call at the point where the asynchronous request is made, but you generally have to add a few to see what’s going on at different points in execution. This is painfully slow, causing you to lose valuable time. Not only that, modern JavaScript projects often use build tools like Grunt, Gulp, webpack, or npm scripts. You have to wait for the build task to complete to see your output, costing even more time.
Web browsers like Google Chrome, Firefox, and Safari have their own JavaScript debuggers. However, if you’re dealing with an application that uses PHP and JavaScript, it’s distracting to keep switching to an external debugger outside the IDE. Being able to debug and inspect everything going on in one place is a huge plus.
This highlights the second advantage of the PhpStorm debugger: having breakpoints reliably saved between page refreshes. The browser debuggers won’t save breakpoints when you refresh the page if there is a cache-busting string appended to the URL in a script tag. Removing the random string and/or setting up source maps for your scripts help, but it’s not always possible.
Convinced yet? Let’s dive in.
To the Workshop
For PHP debugging, you’ll need to set up PhpStorm to debug your PHP scripts with Xdebug, which also requires you to install the Xdebug browser extension. JavaScript debugging in PhpStorm is only supported on Chrome or Chromium-based browsers, so to keep things consistent you’ll need to install and enable the Chrome Xdebug helper for the local site you are debugging. I personally use Brave, but any other Chromium browser should work.
You can then configure the PhpStorm JavaScript debugger. The PhpStorm documentation goes in-depth, but I’ll cover the basics here.
First, you create a JavaScript debugging configuration. From the PhpStorm menu, click Run and then Edit Configurations. This opens the “Run/Debug Configurations” dialog.

Next, click the plus sign in the top left to add a new configuration and then select JavaScript Debug from the select box.

This will create the new JavaScript Debug Configuration, and ask you to enter a “Name” and “URL”.

You can select the browser you want to use for JavaScript debugging from the browser dropdown. As mentioned earlier, this needs to be a Chromium-based browser. Even if you try to edit the available list of browsers and enable Firefox it won’t come up as an option. Believe me, I tried!
Once you’ve set up the JavaScript debugger, you’re all set, and you can start debugging your PHP and JavaScript code in the same session.
Debugging JavaScript and PHP
We already cover how to debug PHP in another article, so I’ll focus on JavaScript here. I’ve created a very small plugin that has a bug in both the PHP and JavaScript code.
The plugin allows an admin user to add a form to any post or page via a shortcode. The form asks for the answer to a math question, and submitting the form displays either an error or a success message. However, it’s not working properly and I’m getting the “Oh dear, an error occurred” message. This plugin uses both PHP and JavaScript and I have no idea where the bugs are.

The PHP code contains three action hook callback functions, one to enqueue an ajax.js JavaScript file, one to process an AJAX request, and one to render the form using a shortcode.
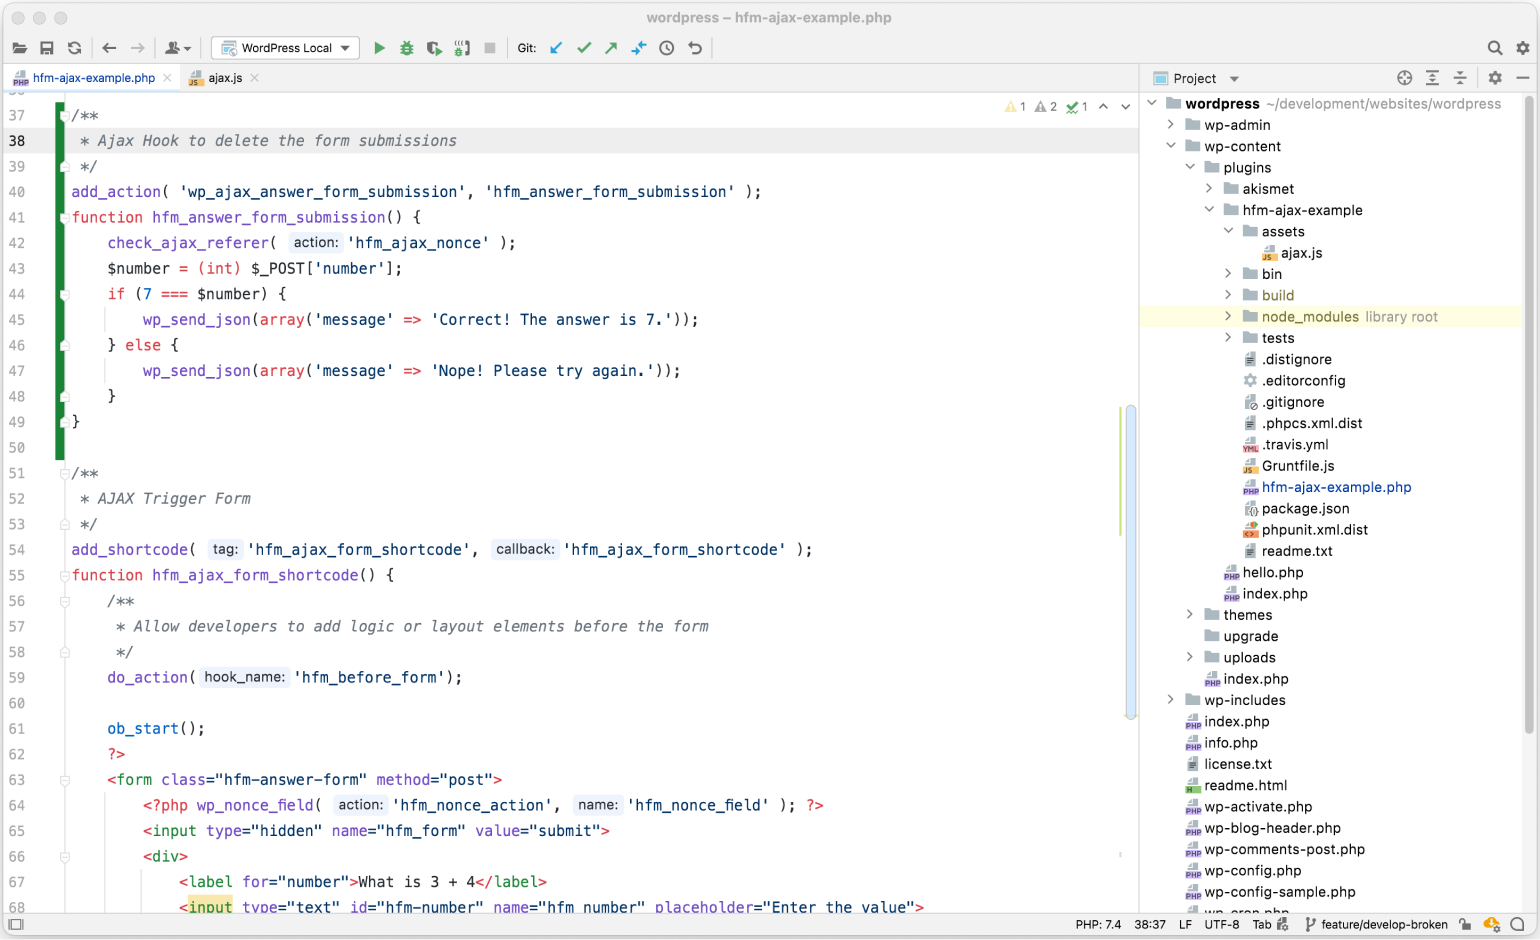
The ajax.js file registers an event listener on the form’s Submit button, which triggers a jQuery ajax request to the WordPress admin-ajax.php URL, and should return the JSON object from the relevant function in PHP, which is then displayed to the user in an alert.
If you’d like to see this entire process in action, you can jump ahead to the full, narrated video of me debugging the code.
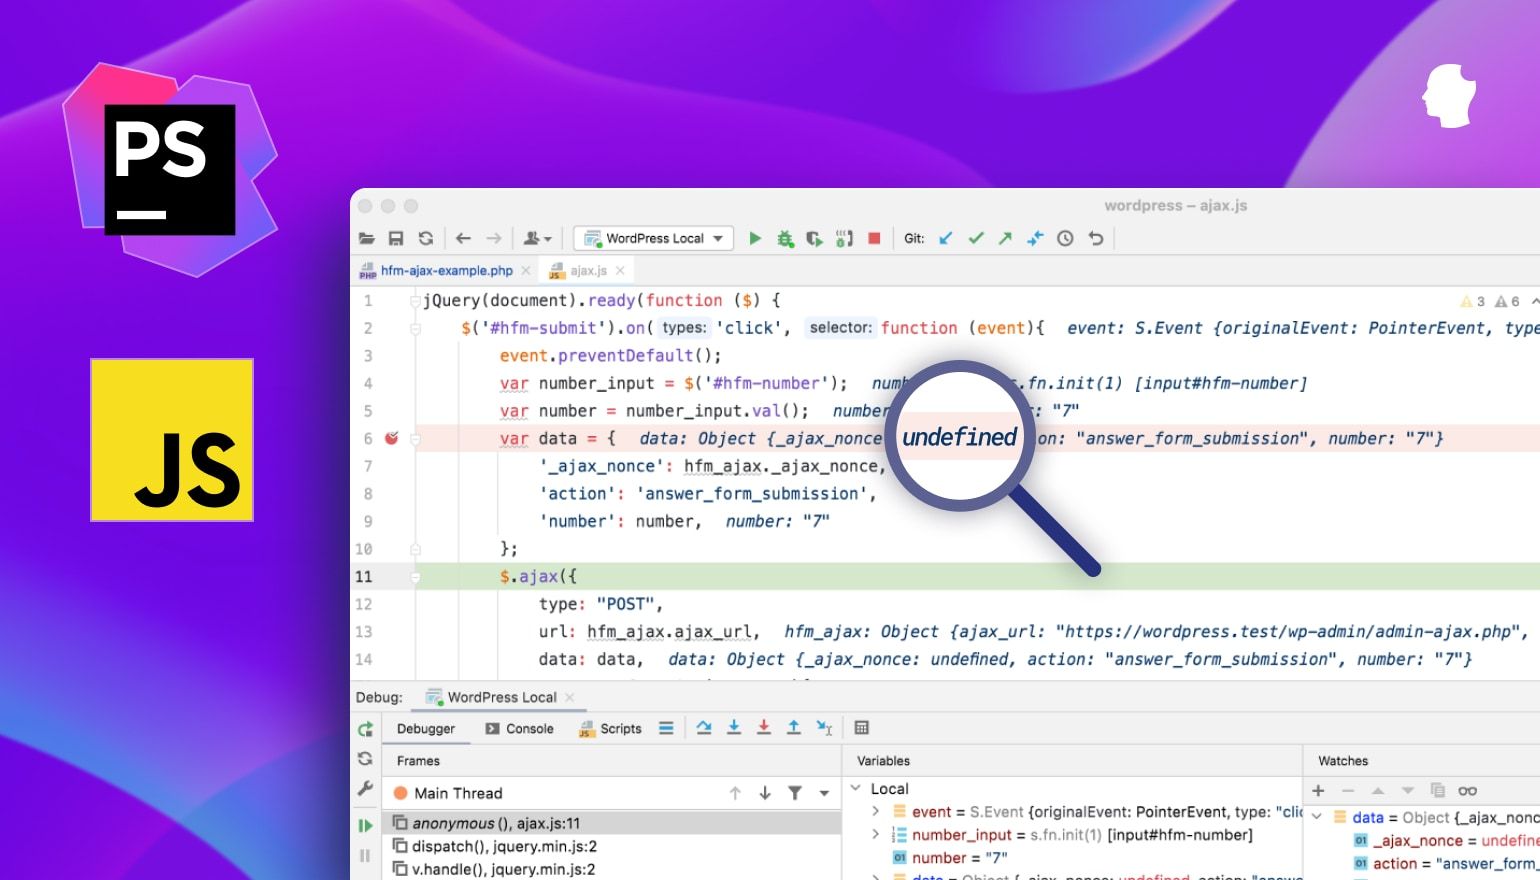
As with PHP, to start debugging JavaScript, I first need to set some breakpoints. In PhpStorm this is a case of clicking in the gutter next to the line of code where you want the debugger to halt execution. In my case, I’ve created a breakpoint in line 6, where the data object is defined.

Then, I need to let PhpStorm know it should start the JavaScript debugger. I do this by clicking on the debug icon in the PhpStorm toolbar:

If you’ve disabled the toolbar, you can also initiate the JavaScript debugger by clicking Run and then Debug from the PhpStorm menu. This will open a new instance of the Chromium browser you specified in the earlier step.
After enabling the breakpoint and the debugging session, I enter a value in the text field and click the “Submit” button. The JavaScript debugger opens at the breakpoint, and I can step through the different lines of code. The benefit of the debugger is that I can inspect any variables in my code in the “Variables” panel, as well as add specific variables to a watch list. In this case I’ve added the data object to a watch list, and I instantly see that the _ajax_nonce object key has an undefined value. I then inspect the hfm_ajax object in the “Variables” panel. I see that the nonce is stored in the nonce key, but in my code, I’m using hfm_ajax._ajax_nonce instead. First bug found!

So I stop the debugger, fix the incorrect code, refresh the browser, and trigger the form submission again. I step through the code and everything is assigned the correct value, but I’m still getting that “Oh dear, an error occurred” message. I switch back to PhpStorm and take a look at the debugger’s “Console” tab. Note that this console output is the same output that I’d see in the browser’s dev tools. Very nifty!
From the error message, I can see that something is going wrong in the admin-ajax.php file. Given that that is a core WordPress file, there’s probably something wrong with my plugin code, but I’m not sure what. What’s great about this setup is that I can click on the admin-ajax.php file in the debugger console to open that file. I can then place a breakpoint in the admin-ajax.php PHP code to see what’s going on.

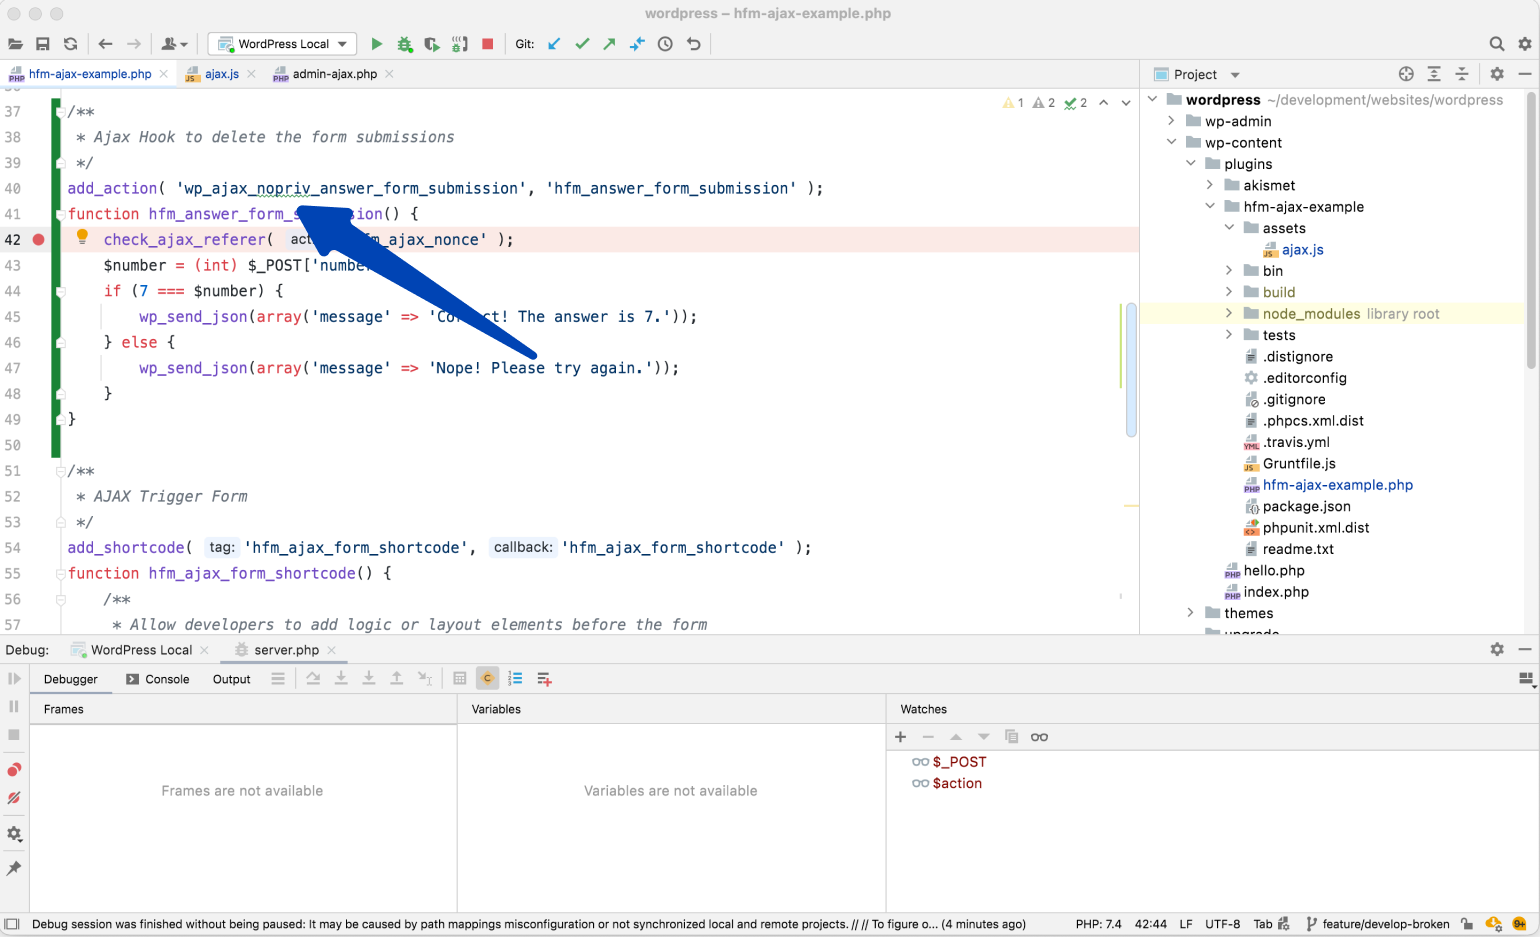
This is a massive time saver! If I was inspecting the console in the browser, I’d first have to determine which PHP file was being called, then switch back to PhpStorm, find it, and set a breakpoint. With the debugger, I just click on the file, and I’m where I need to be. I place a breakpoint in the spot where admin-ajax.php creates the $action variable, then click the “Submit” button on the form again.

The debugger session is still active, and it stops at the first breakpoint in ajax.js. That’s fine, so I step through the code to see what happens. As it turns out, it gets to the point of looking for an action hook with the format of wp_ajax_nopriv_{$action}, which instantly triggers my memory. 💡

When I registered the relevant action hook in the PHP plugin code, I didn’t use the nopriv_ option to indicate an Ajax request that doesn’t require a logged-in user. I let the code finish execution, switch back to my PHP code, and change the action hook to wp_ajax_nopriv_answer_form_submission. Just to be sure, I also place a breakpoint at the first line in the callback function, so I can step through that code in case there are any other bugs.
Fortunately, there are no more bugs in the code, and it executes successfully.

All in all, this process took about 2 minutes to figure out.
Debugging in Action

Being able to switch between debugging JavaScript and PHP code was vital to figuring out this problem. If I was only relying on using Xdebug for the PHP code, or even using PHP’s error_log() function to log to the debug.log file, and then using JavaScript’s console.log() function to log to the console, I’d have to check multiple places and keep reloading the page each time to trigger the code and see changes. With the debugger, I can see immediately what’s going on, make the necessary changes, and rerun the code to see the results.
Working With Build Tools
Right now you probably want to run off and try this yourself, but before you do that, let’s talk about build tools. Depending on your development setup, you might be using task runners like Grunt or Gulp. They may take multiple JavaScript files, concatenate them into one final production file and minify the code at the same time, or minify a single source file to a production file that’s served to the browser. You might be working with a JavaScript framework like React or Vue, which uses webpack and bundles the source code into a single JavaScript file.
Task Runners
Another advantage of the PhpStorm JavaScript debugger is that it allows you to define tasks or scripts to run before debugging is started. If you use Grunt or Gulp this is a helpful addition. However, you’ll have to make sure your breakpoints are in the right files. Depending on where your final production files are stored, you’ll need to make sure the breakpoints are in these files, rather than the source files.
What many developers do instead is make use of the WordPress SCRIPT_DEBUG constant, and specify a different file to be enqueued for WordPress depending on that constant.
/**
 * If SCRIPT_DEBUG is defined as true, then set the JavaScript file to the source version
 * Otherwise, set it to the dist version
 */
if ( defined( 'SCRIPT_DEBUG' ) && SCRIPT_DEBUG ) {
    $script_src = ( '/path/to/source/js/javascript.js' );
} else {
    $script_src = ( '/path/to/dist/js/javascript.js' );
}
/**
 * Register the JavaScript file for WordPress
 */
wp_register_script(
    'hfm-javascript',
    $script_src,
    array(
        'jquery',
        'jquery-ui-core',
        'jquery-ui-datepicker'
    ),
    '1.0.0',
    true
);
/**
 * Enqueue the JavaScript file
 */
wp_enqueue_script( 'hfm-javascript' );
Now all you need to do to set breakpoints on the source files is define the constant as true in your wp-config.php while you are debugging.
Module Bundlers
Module bundlers like webpack are a different story. If you’re using webpack, it’s usually because the JavaScript framework uses a syntax browsers can’t understand without transpiling the source code. An example of this is a WordPress block, which makes use of the React framework and the JSX syntax.
I’ve added block editor support and a custom testimonial block to my example plugin to show how this works. This is what the block JSX for the edit component looks like:
export default function Edit() {
    return (
        <p {...useBlockProps()}>
            {__(
                'Testimonial Block – hello from the editor!',
                'testimonial-block'
            )}
        </p>
    );
}
This is the part of the transpiled code that registers the testimonial block, including the edit and save components. I had to reformat the transpiled index.js file to find this code—another handy PhpStorm feature—as it’s all minified on one line in the final transpiled file.
    var e, n = {
        273: function () {
            var e = window.wp.blocks, n = window.wp.element, o = window.wp.i18n, r = window.wp.blockEditor;
            (0, e.registerBlockType)("create-block/testimonial-block", {
                edit: function () {
                    return (0, n.createElement)("p", (0, r.useBlockProps)(), (0, o.__)("Testimonial Block – hello from the editor!", "testimonial-block"))
                }, save: function () {
                    return (0, n.createElement)("p", r.useBlockProps.save(), (0, o.__)("Testimonial Block – hello from the saved content!", "testimonial-block"))
                }
            })
        }
    }, o = {};
If I wanted to debug the edit component, I’d run the build script, reformat the transpiled code, and set the breakpoint on the edit:function(){ line. Manually formatting the transpiled code to figure out where to set the breakpoint after running npm run build every time you make a change is going to get old quickly though.
Fortunately, the folks at Jetbrains also offer a product for frontend developers called WebStorm. WebStorm is essentially PhpStorm without support for PHP and related technologies, with a focus on frontend development and frameworks like React, Vue, or any other framework that uses webpack. It even supports features like language injection for inline CSS. PhpStorm ships with all the same functionality WebStorm does.
I had to do a little digging on the WebStorm blog, but it turns out that both WebStorm and PhpStorm support debugging JavaScript when your project is running in “development mode” using the webpack dev server. For most webpack based projects, all this means is ensuring you run npm run start before you enable JavaScript debugging.
You might need to update the JavaScript debugging URL to match your webpack dev server URL if it’s running on a different URL. In the case of developing a WordPress block, the webpack dev server URL is the same as the WordPress site URL, so I didn’t need to change anything.
I opened the edit.js file of the new block, placed a breakpoint, and ran npm run start to kick off the development server. Once that was running, I initiated the JavaScript debugger. I then went into the WordPress admin, edited a post, and added the testimonial block to the block editor. Lo and behold, PhpStorm’s debugging kicked in, and I could step through the JSX code for the block.

Scratching the Surface
I hate using the word “easy” in a technical tutorial, but if you can follow the PhpStorm zero-configuration debugging configuration steps to start debugging PHP, creating the one (or two) JavaScript debug configurations is not any more challenging. I was expecting to spend hours wrangling everything. In the end, it took me about 30 minutes to set up and start debugging my JS files. Then another hour of reading the docs, creating a separate React app in PhpStorm, and inspecting the debug configurations to replicate it for my WordPress block.
Coupled with Xdebug for PHP debugging, the PhpStorm JavaScript debugger makes for a powerful combination to aid in debugging and digging into complex code. While using things like error_log and console.log are still useful, if I’m hunting down hard to find bugs across code that spans PHP and JavaScript, this is going to save me time and headaches. I only wish I knew about this when I was learning to build custom WordPress blocks!
This article only scratches the surface of what the PhpStorm debuggers can do, but I hope it encourages you to give it a try on your next project!
Do you use the PhpStorm debugger? What are some ways you use to debug complex JavaScript code? Let us know in the comments!