As a web developer, there’s always that curiosity about what your peers are up to. Where are they from? How much do they make? Do they work remotely? Over the years, we’ve received questions from our blog readers wanting to know these answers and more so we decided to pull together a little industry survey to find out.
We received 420 responses and got some real insight into the careers of WordPress developers. We found out about experience levels, how freelancers are getting clients and much more.
Let’s dive in.
Location
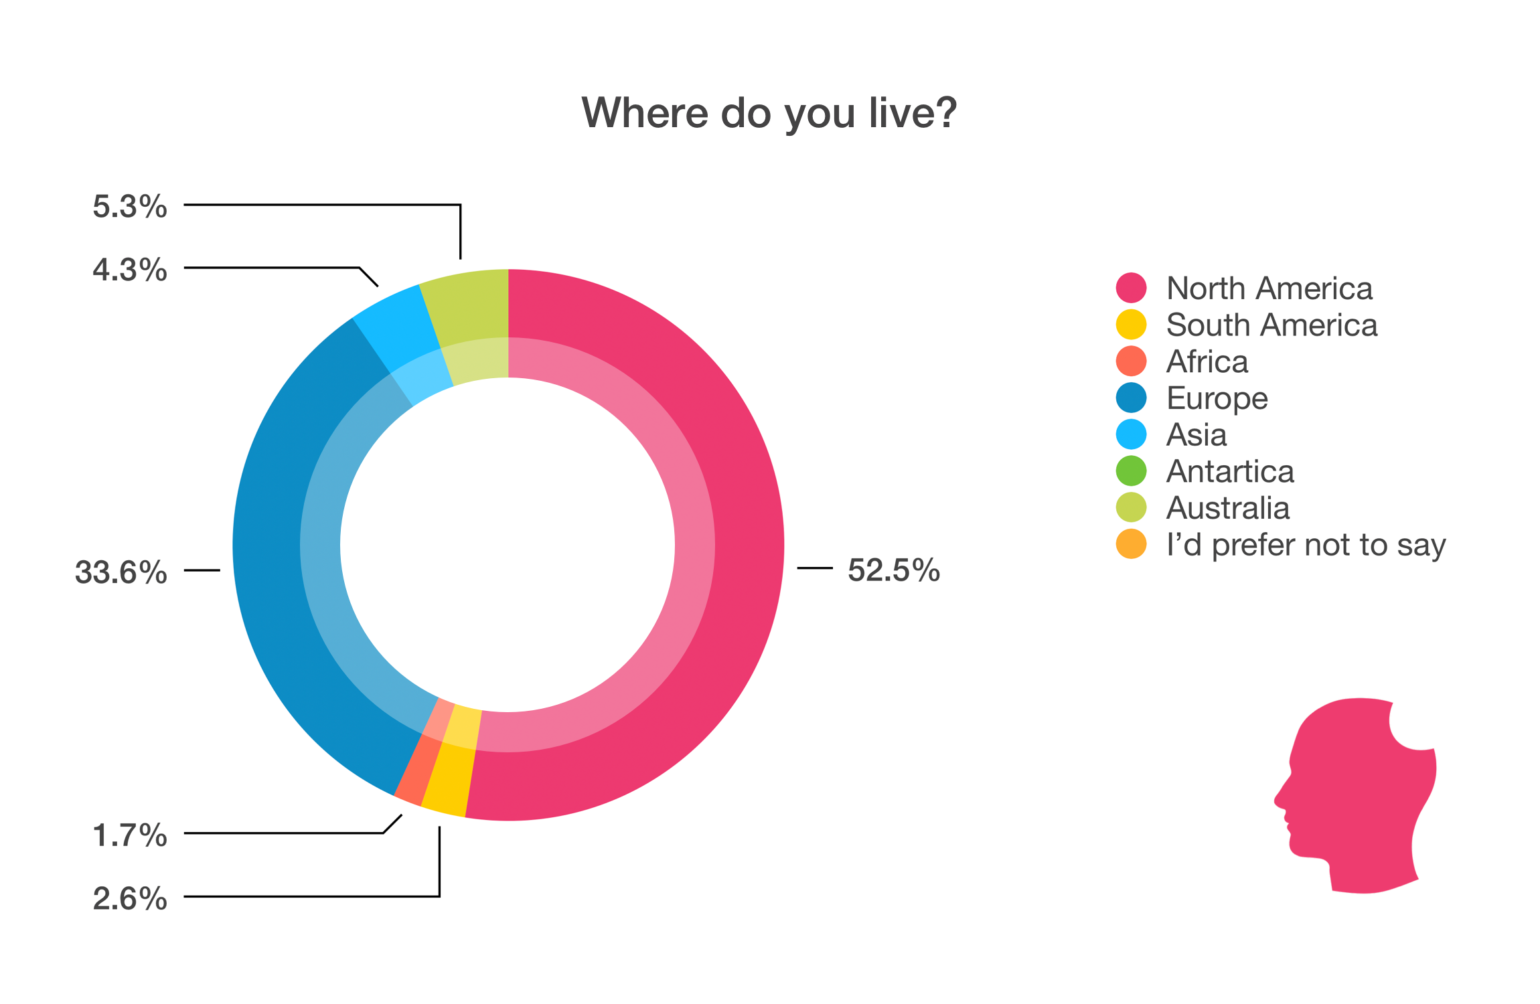
A little over half, 52.5%, of respondents, are based out of North America and 33.6% live in Europe. We heard from people around the globe, from almost every continent (except Antarctica – which isn’t an ideal environment for a web developer; their computer would always freeze 🥶).
Audience profile
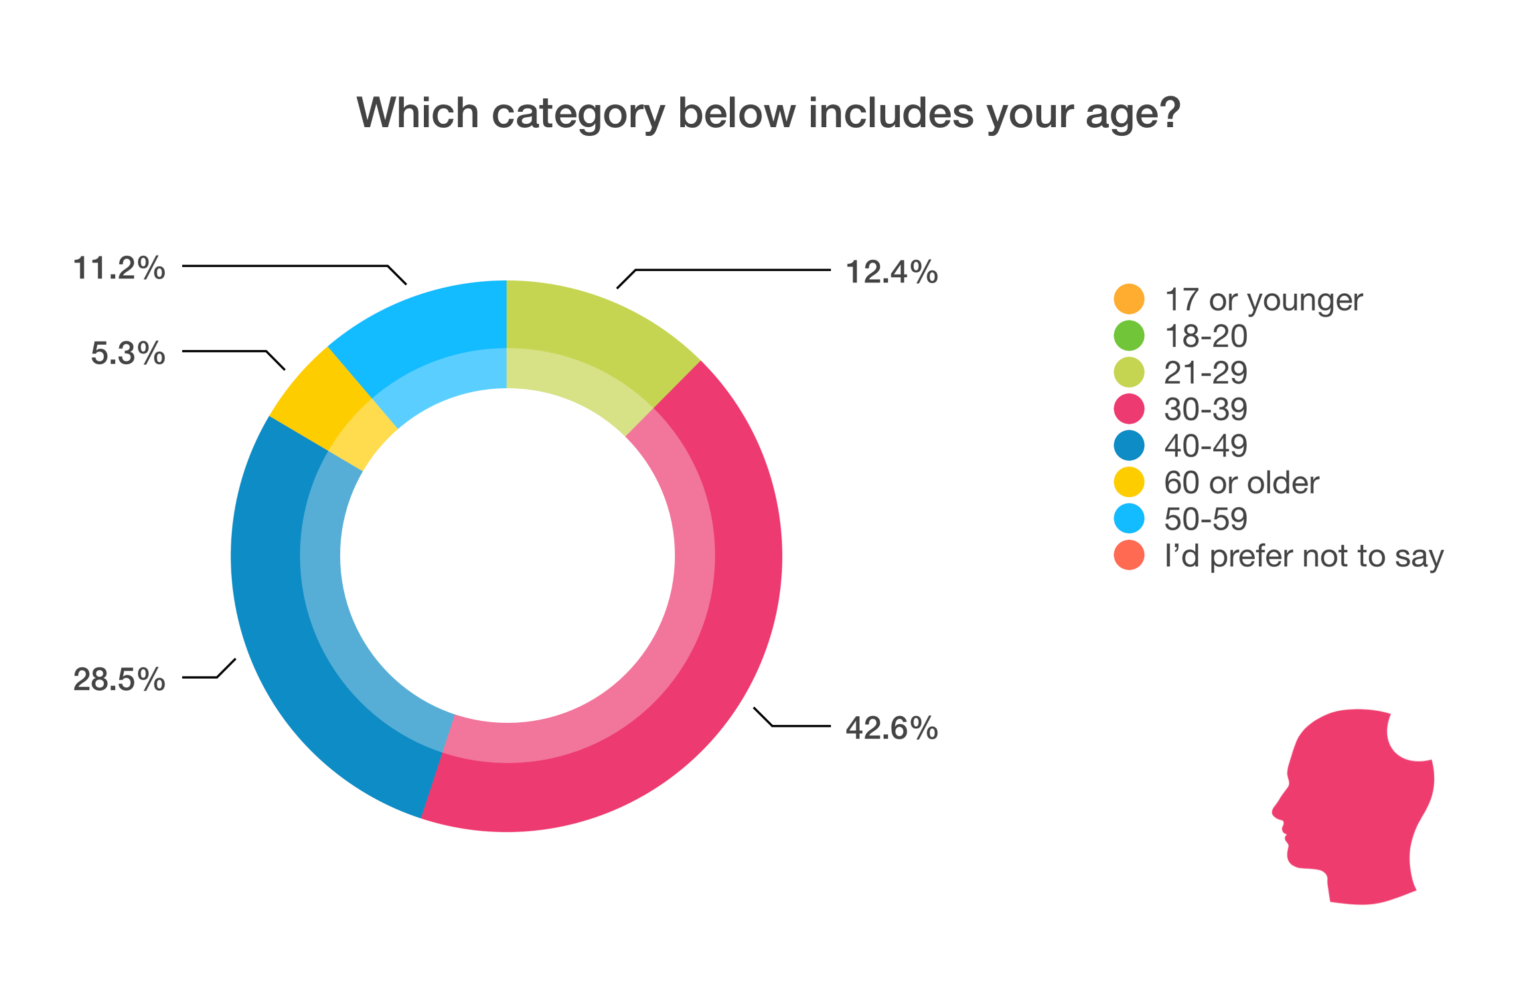
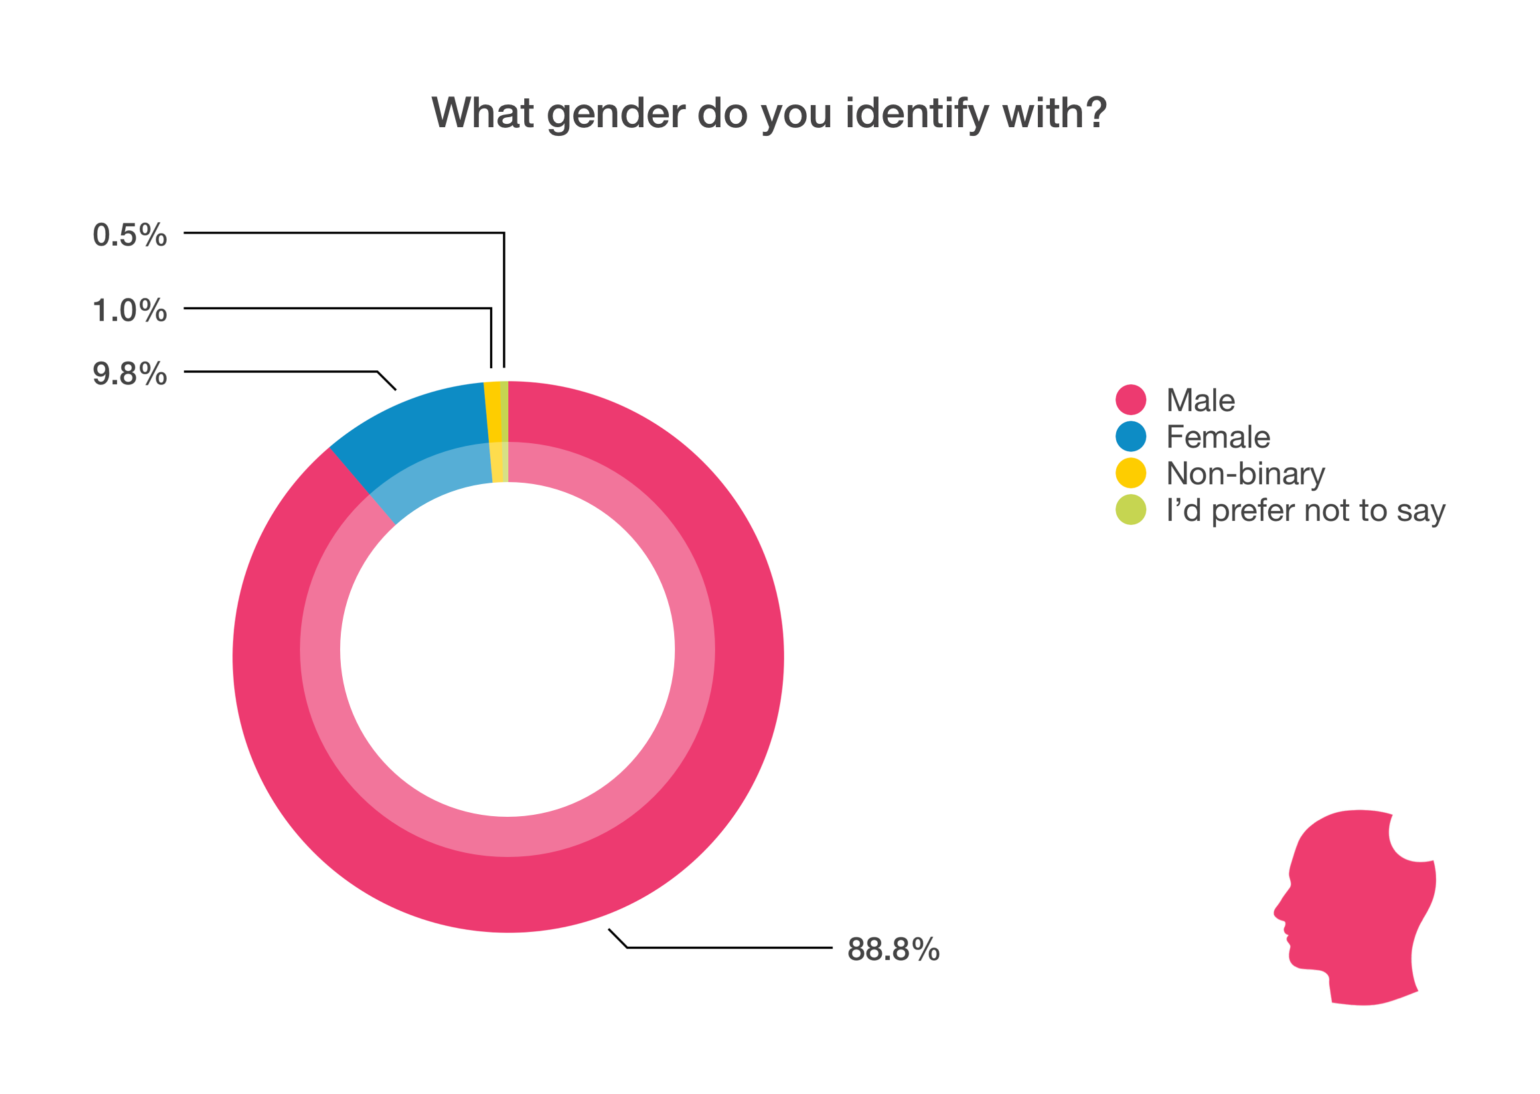
Of the respondents, 42.6% are between 30 and 39 years old, followed by 28.5% between 40 and 49 years old. Most respondents, 88.8%, are male.
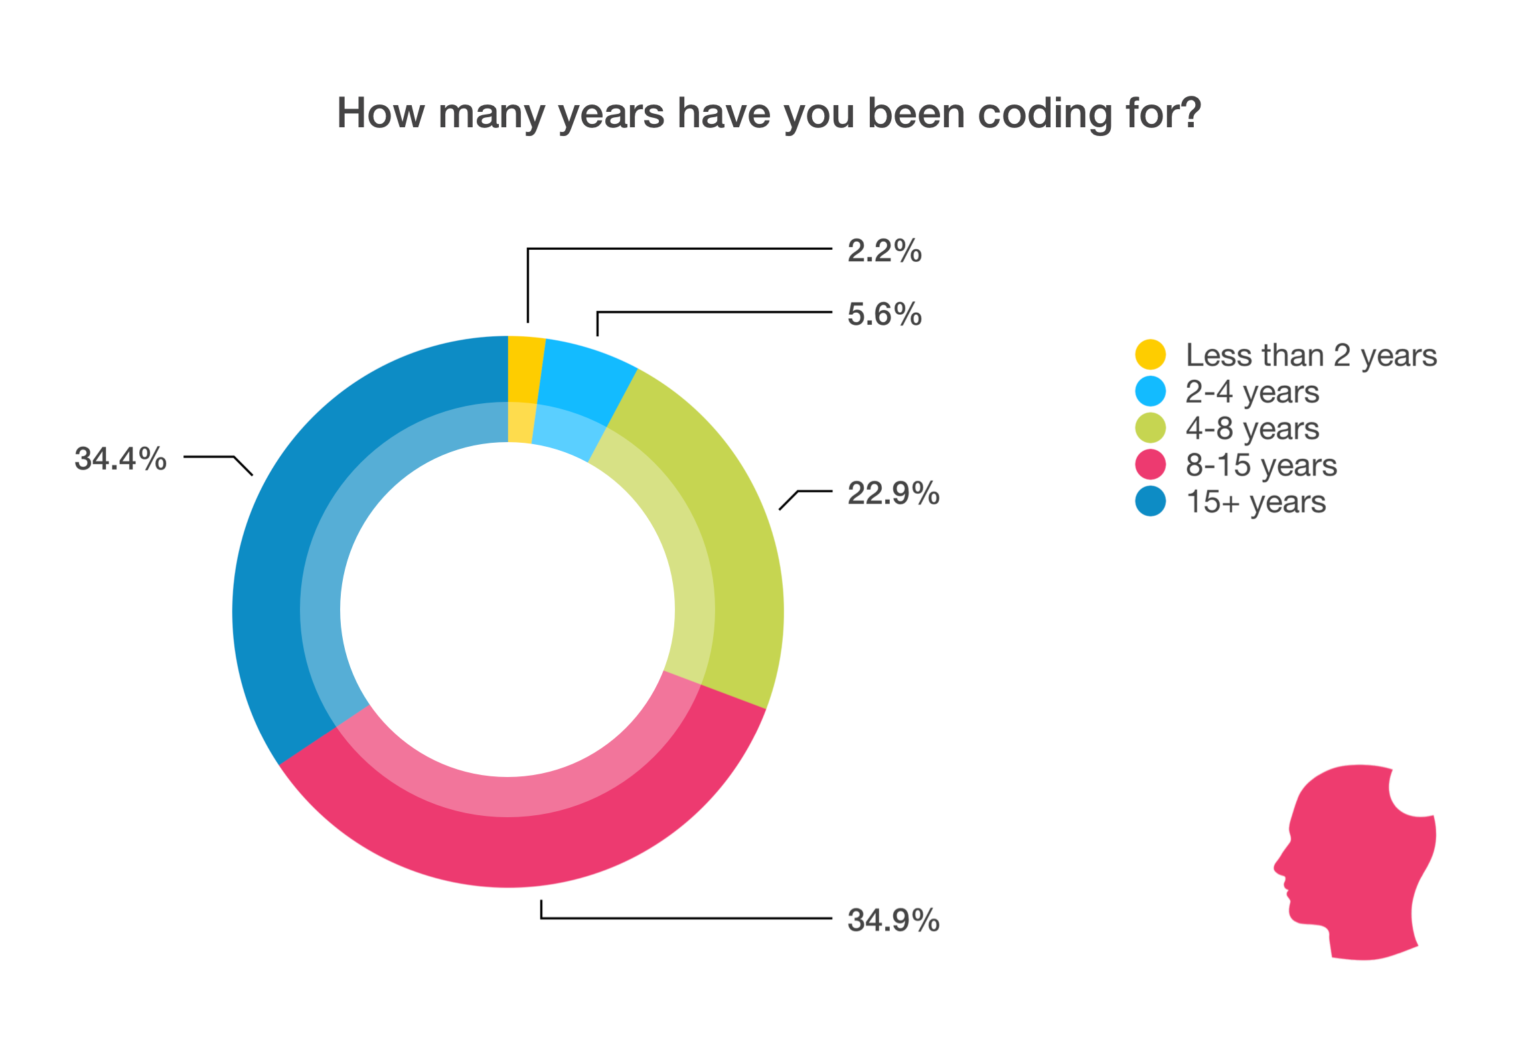
Almost 35% of web developers who took our survey have 8 to 15 years of experience and 34.4% have more than 15 years of experience. What about those with less experience? Have they always been working in web development?
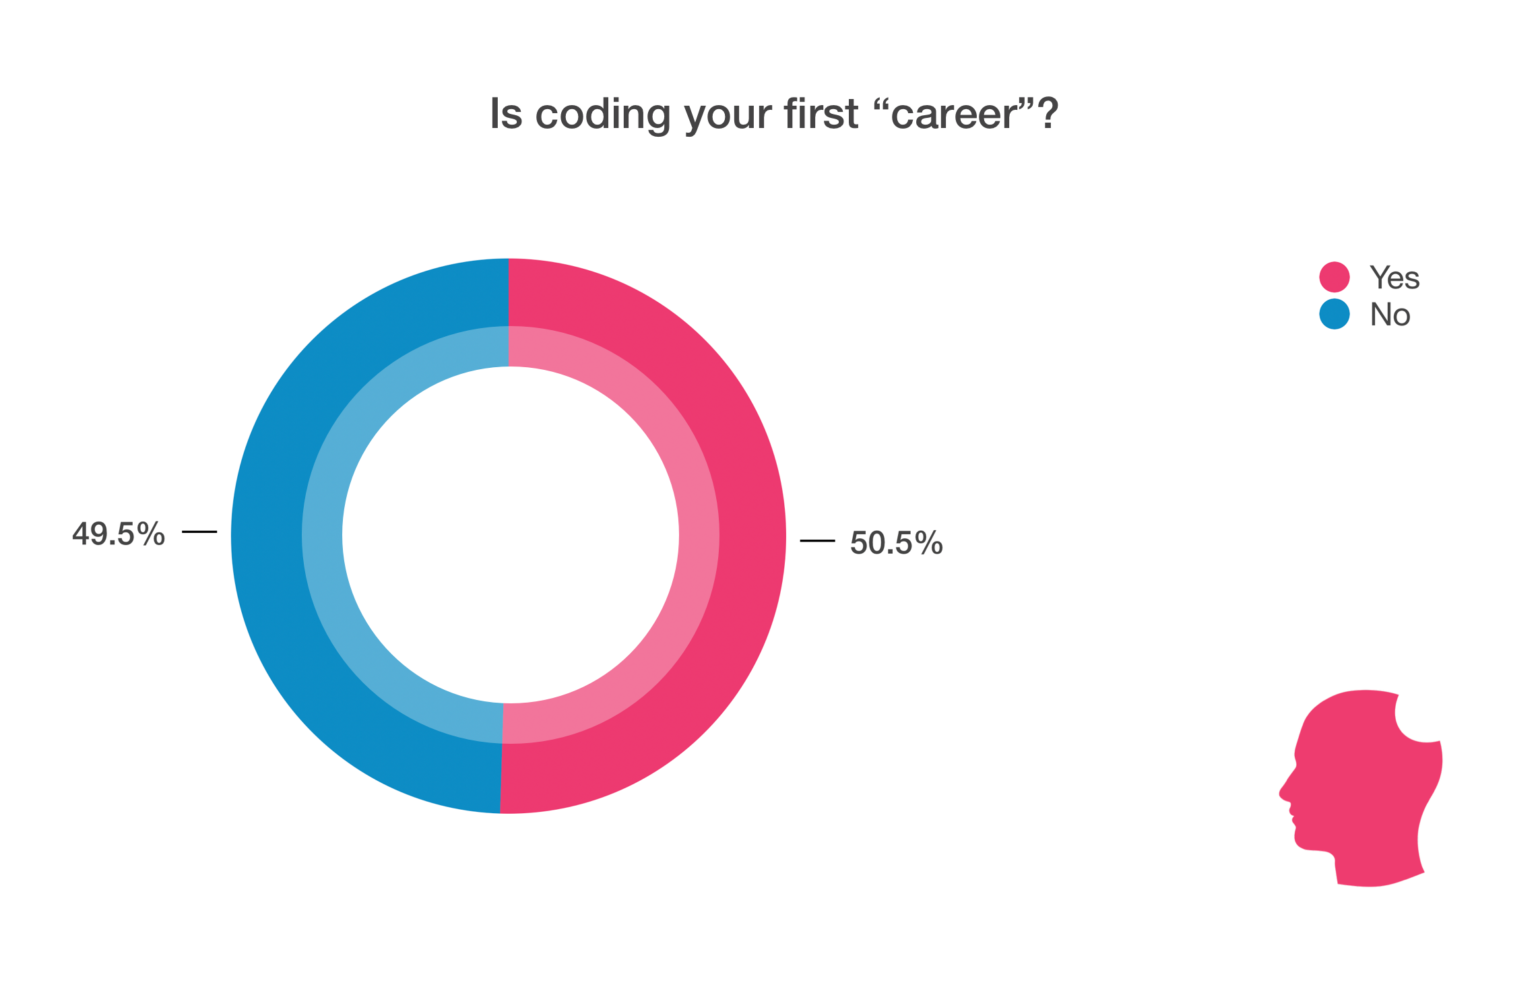
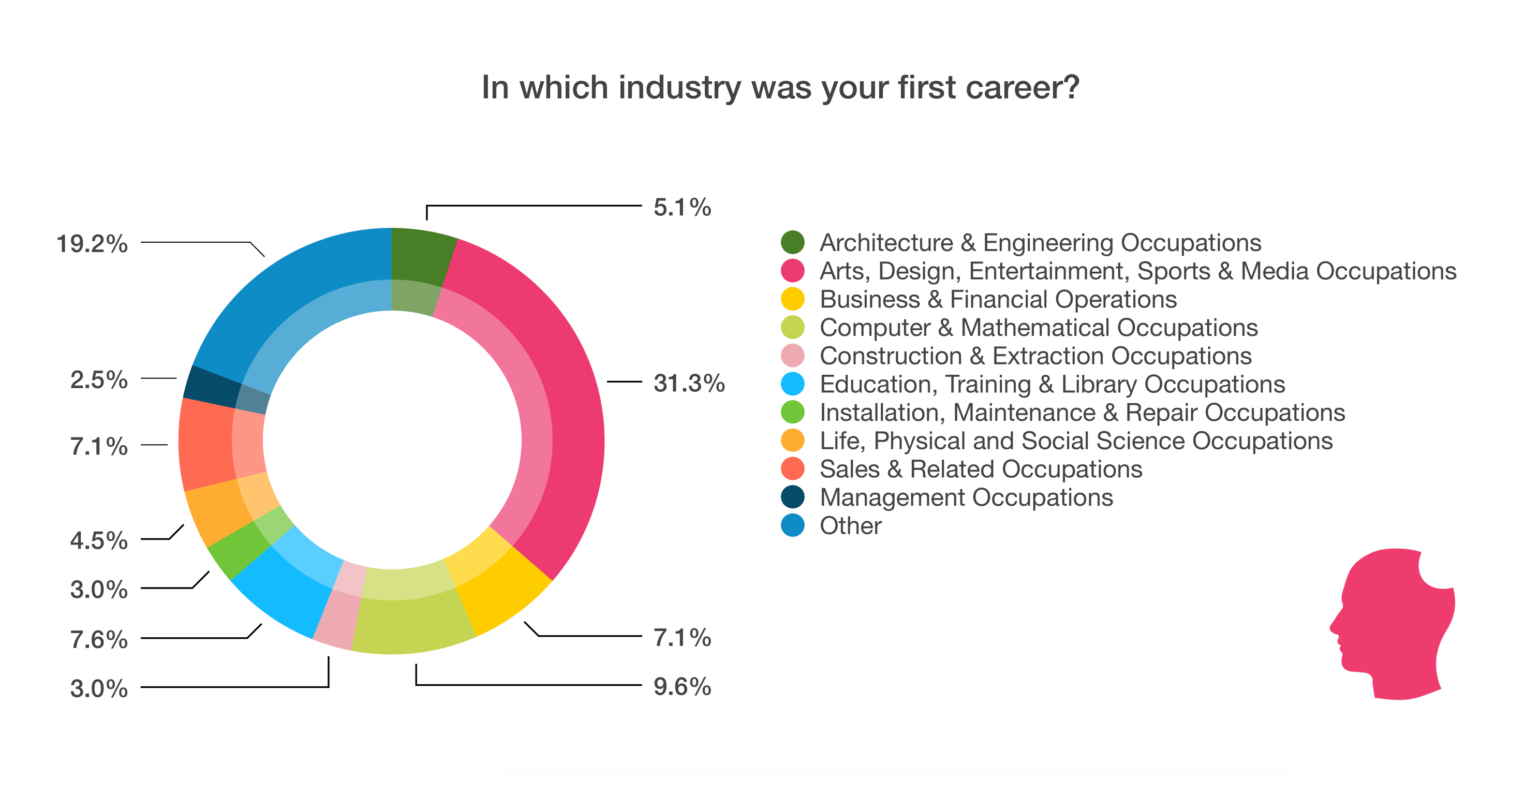
For nearly half of respondents, their first career wasn’t in web development. Of those, 31.3% started off their careers in the arts, design, entertainment, sports or media. It makes sense as that field requires a creative mind, much like development does.
The second most popular first career was in computer and mathematical occupations at 9.6%. Switching to a coding career from this area would be a natural step as it’s very likely one would get exposed to coding through this field. The analytical skills that would have helped these respondents in their first career will have no doubt contributed to their coding career as well.
The rest of respondents came from various backgrounds from education to transportation. It’s fantastic that our community comes from such diverse career backgrounds, each of which brings a different perspective to the job.
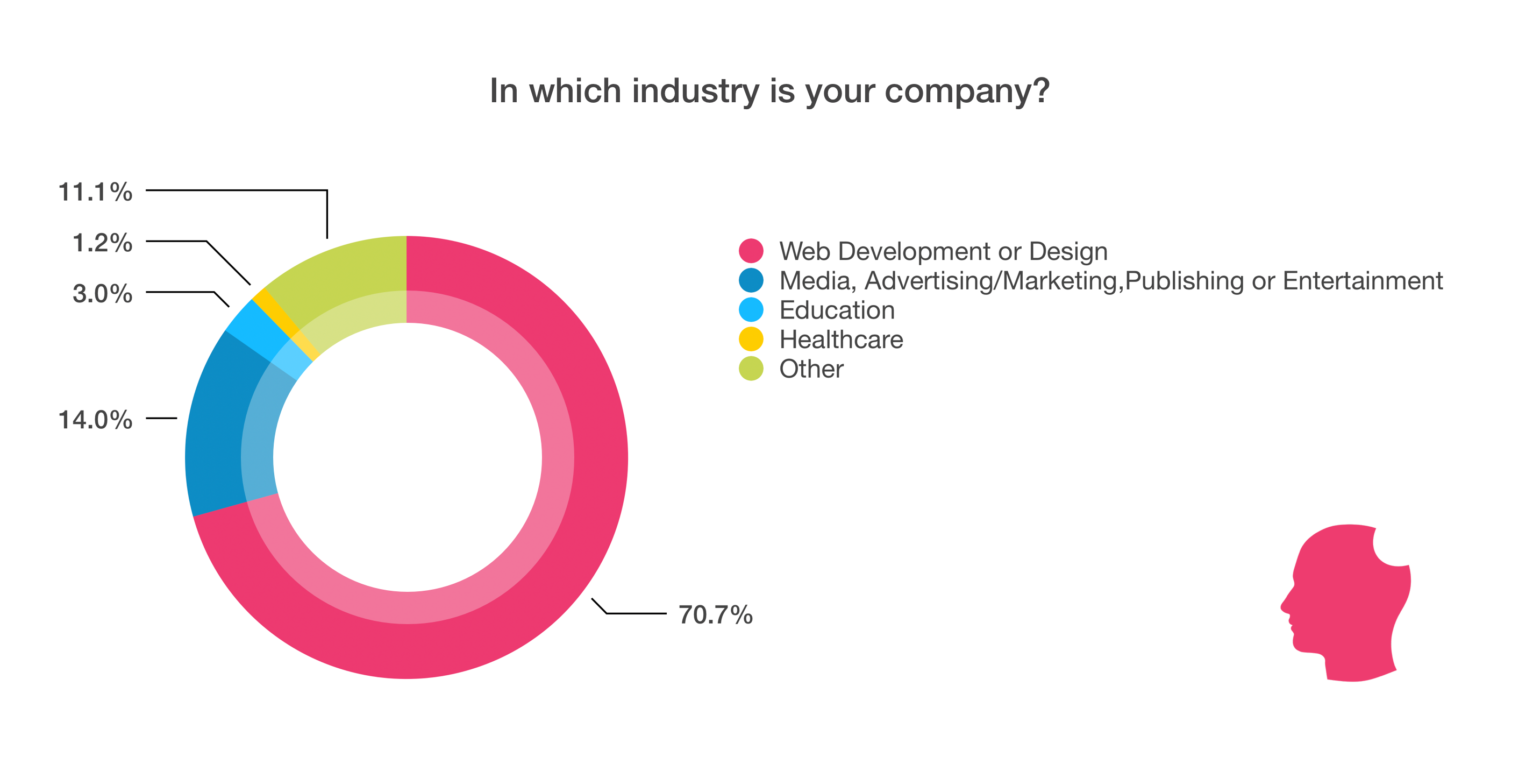
The majority of respondents’ (70.7%) companies are in the web development or design industry with the second most popular (14%) industry being media, advertising/marketing, publishing or entertainment. The remaining ~15% came from various other industries.
Employment
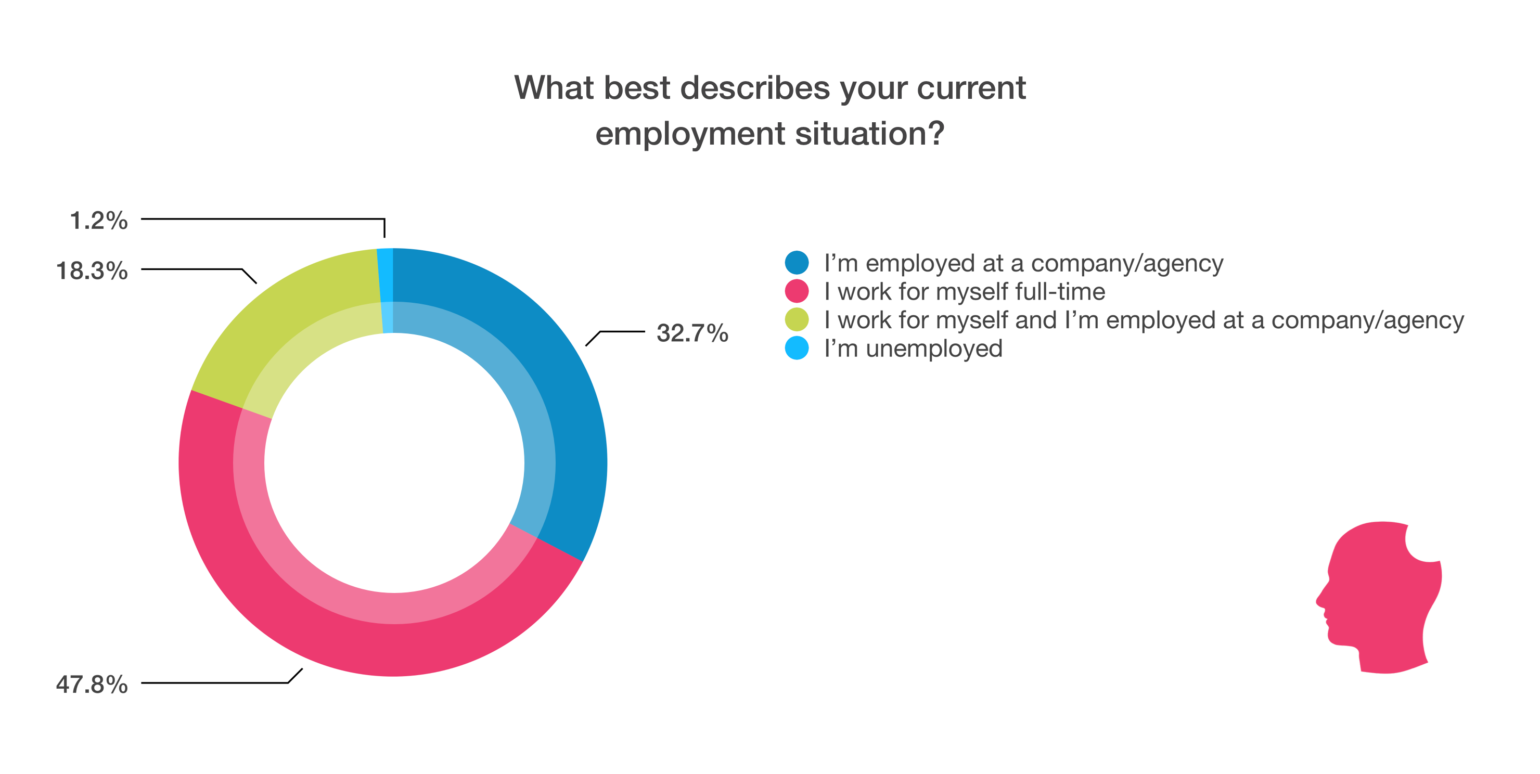
Almost half, 47.8% of respondents, work for themselves full-time. Those employed with a company made up 32.7% while 18.3% are doing double duty – working for themselves and are also employed at a company/agency. Working for yourself while employed at a company can be an excellent way to transition to working for yourself full-time or to run your own business without the worry of where your next paycheck is coming from.
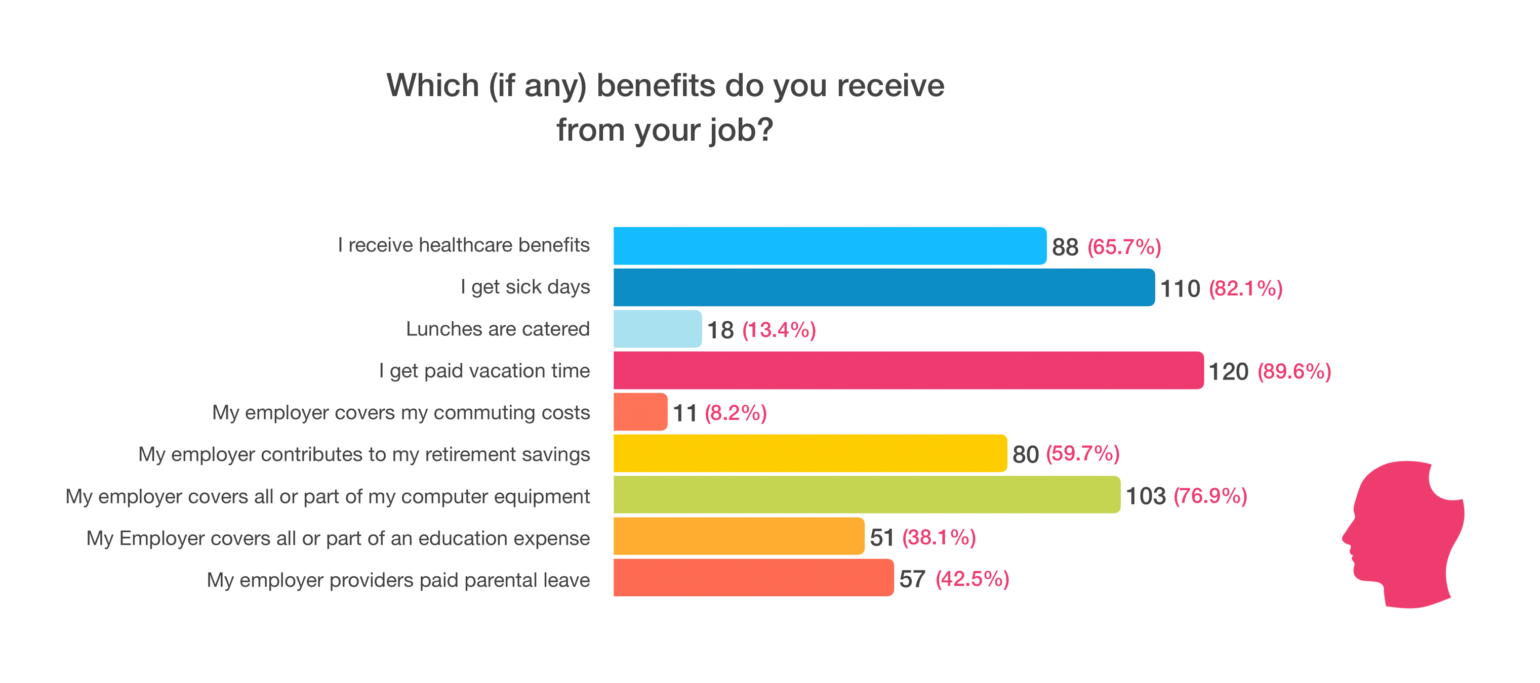
Benefits can be extremely important to some and are often on the negotiating table through the job offer process. Almost 90% of respondents who work for a company at least part of the time, said they receive the traditional benefit of paid vacation time. For the 81.8% that reported getting paid sick days, they can rest up and get back at it.
As a web developer, having a reliable computer is imperative and it seems companies employing our respondents understand that. Almost 77% of respondents who work for a company have all or part of their computer equipment covered.
Clients and work
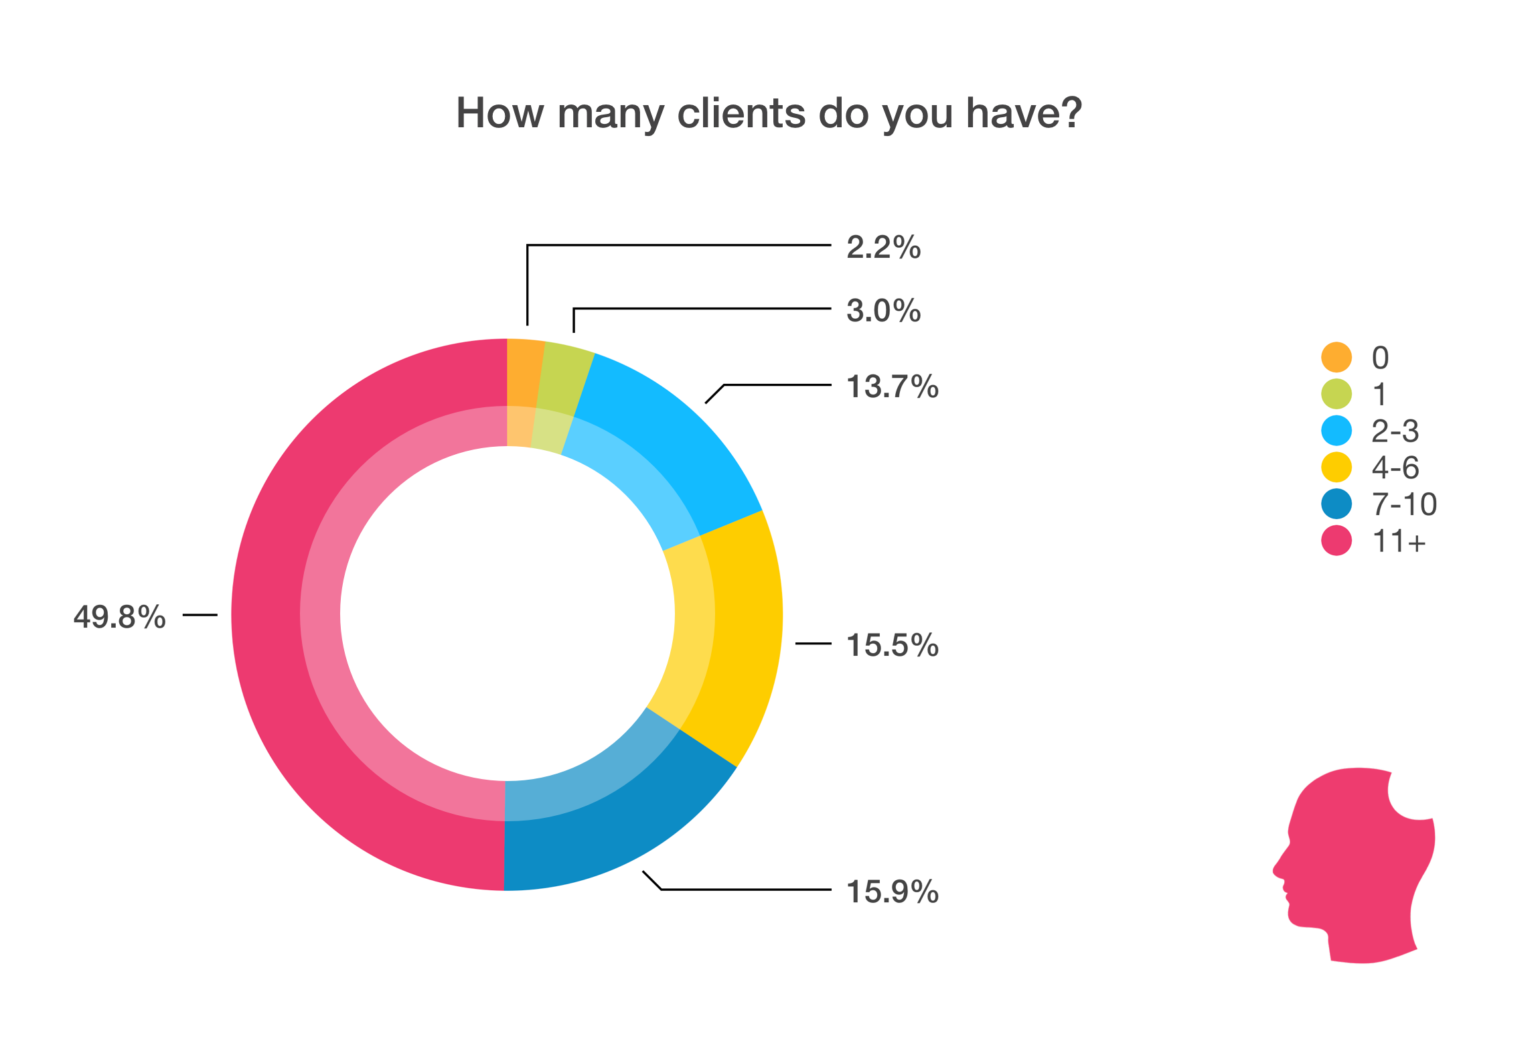
Almost half of those who work for themselves full-time or work for a company and for themselves have 11 or more clients. Those with fewer than 11 clients are dispersed fairly evenly between 2-3 clients, 4-6 clients and 7-10 clients. About 5% have 0-1 client.

A little over 80% of those who work for themselves credit referrals as their top source for new clients. Existing client referrals are responsible for 66.1% of those. It truly speaks to how some of the best advertising you can do for yourself is a job well done. What do you do when you have too many clients and you get offered another gig? You recommend one of your peers. According to 16.2% of those who work for themselves, that’s where they get most of their new clients.
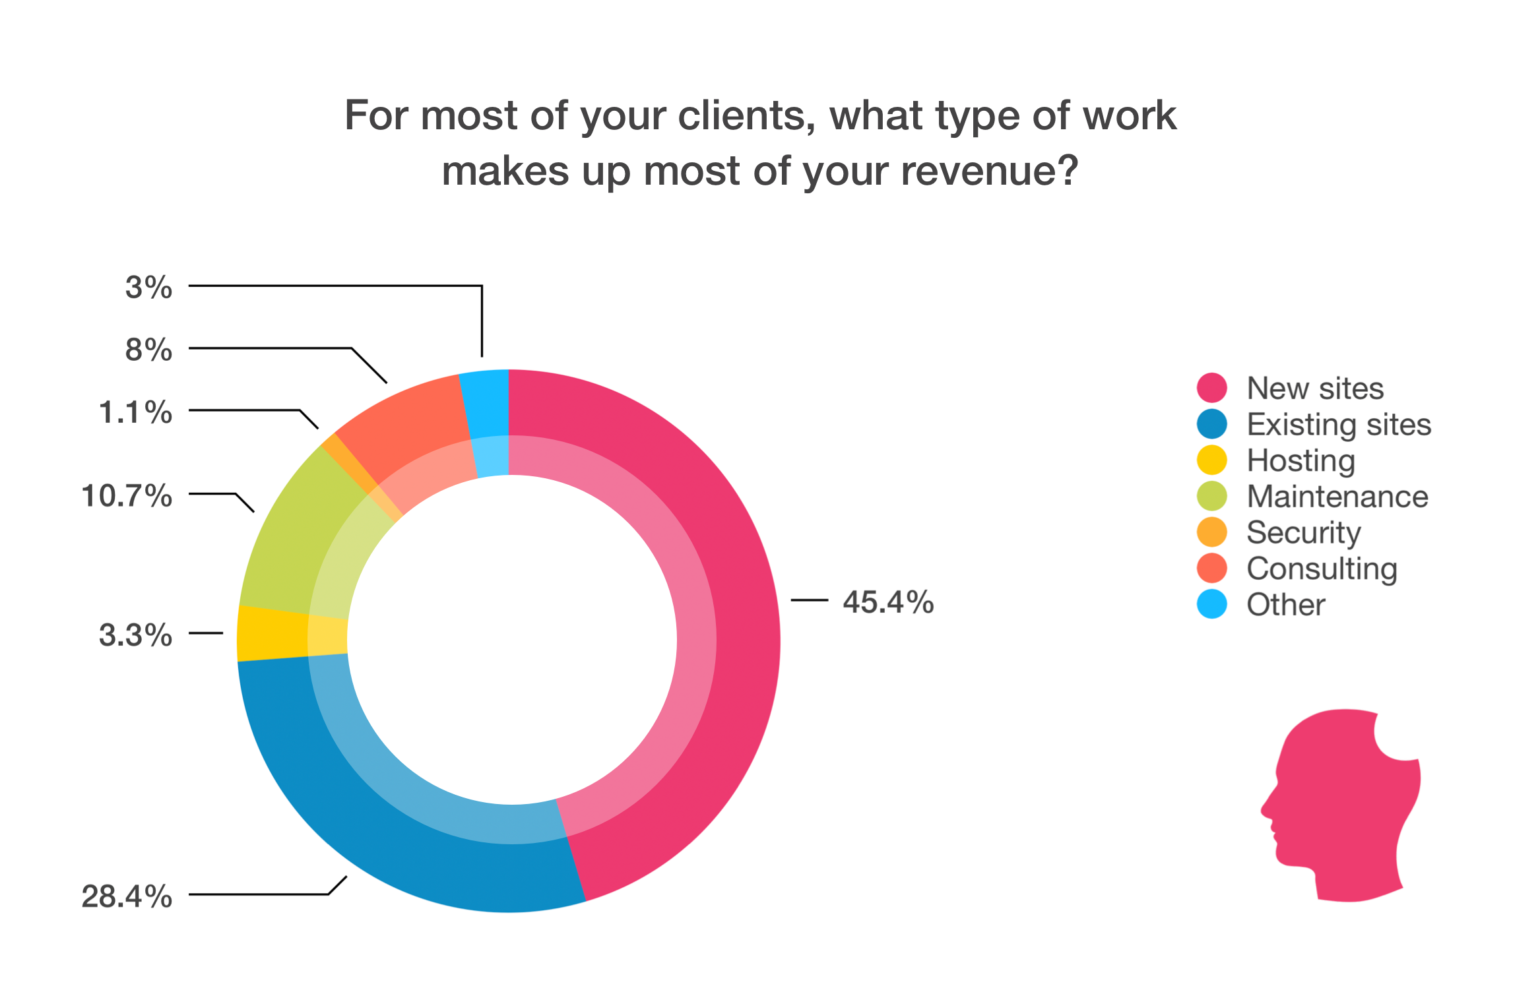
For 45.4% of respondents who work for themselves, new sites make up most of their revenue while existing sites account for the most revenue for 28.4%. Providing maintenance is a great way to ensure ongoing work, as you can see with 10.7% of respondents stating maintenance as the type of work making up most of their revenue.
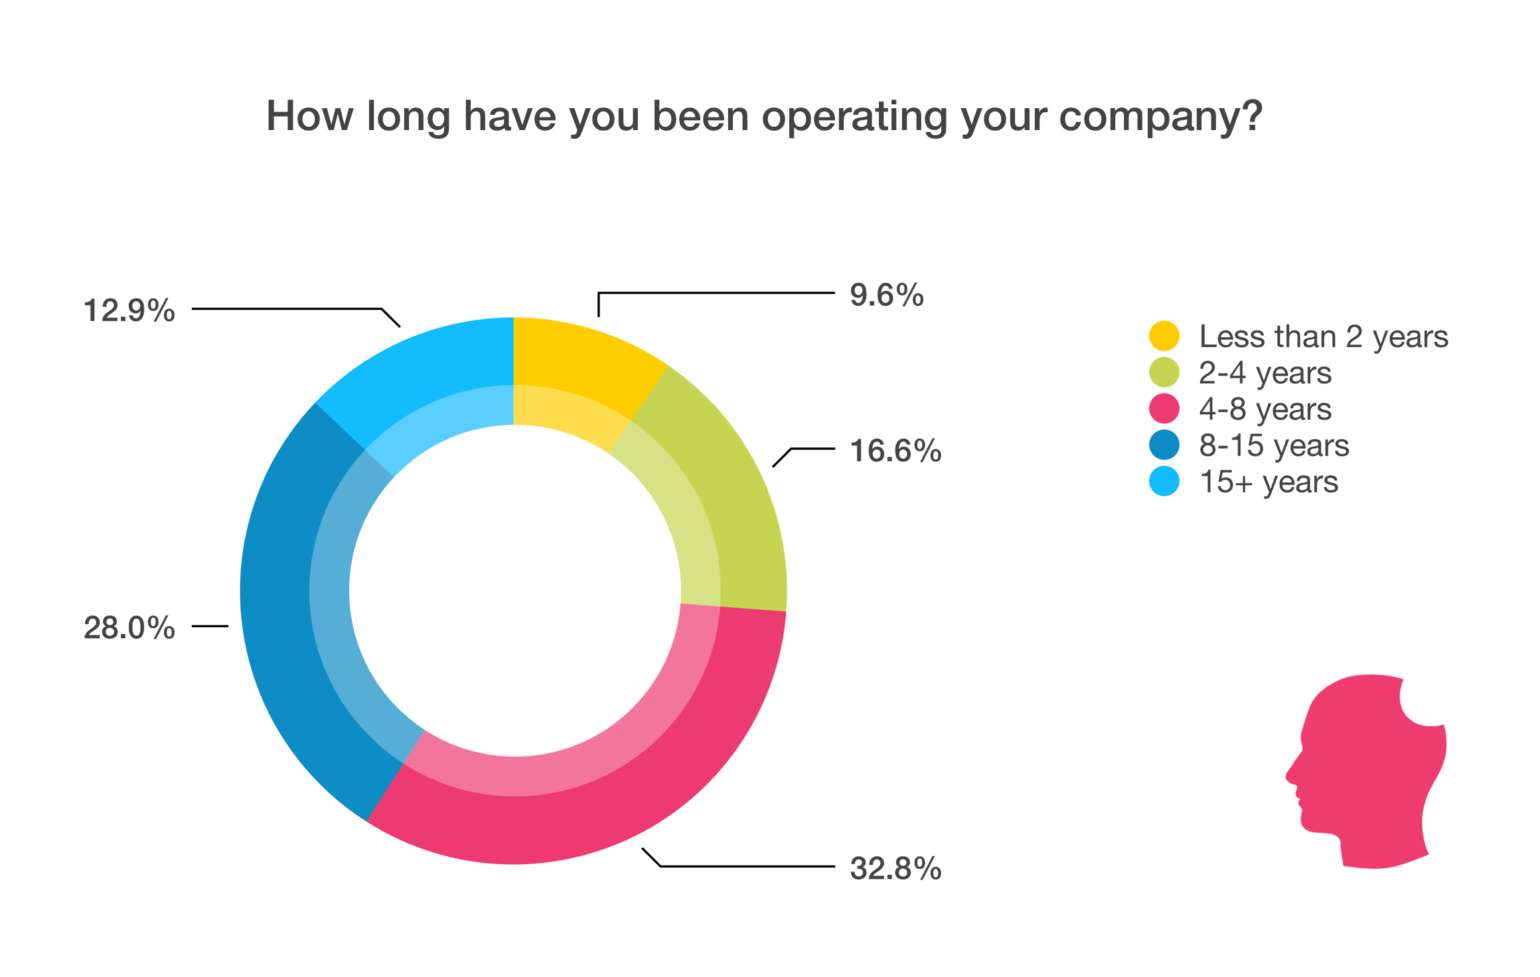
From respondents who operate their own company, about a third have been in operation for 4 to 8 years. Following closely behind, 28% have been operating their business for 8 to 15 years. Within the last 2 to 4 years, 16.6% have started their company with 9.6% in the past 2 years. There was even 12.9% who have been operating for over 15 years, showing how adaptable many developers have been – a necessity in this ever-changing field.
Workflow
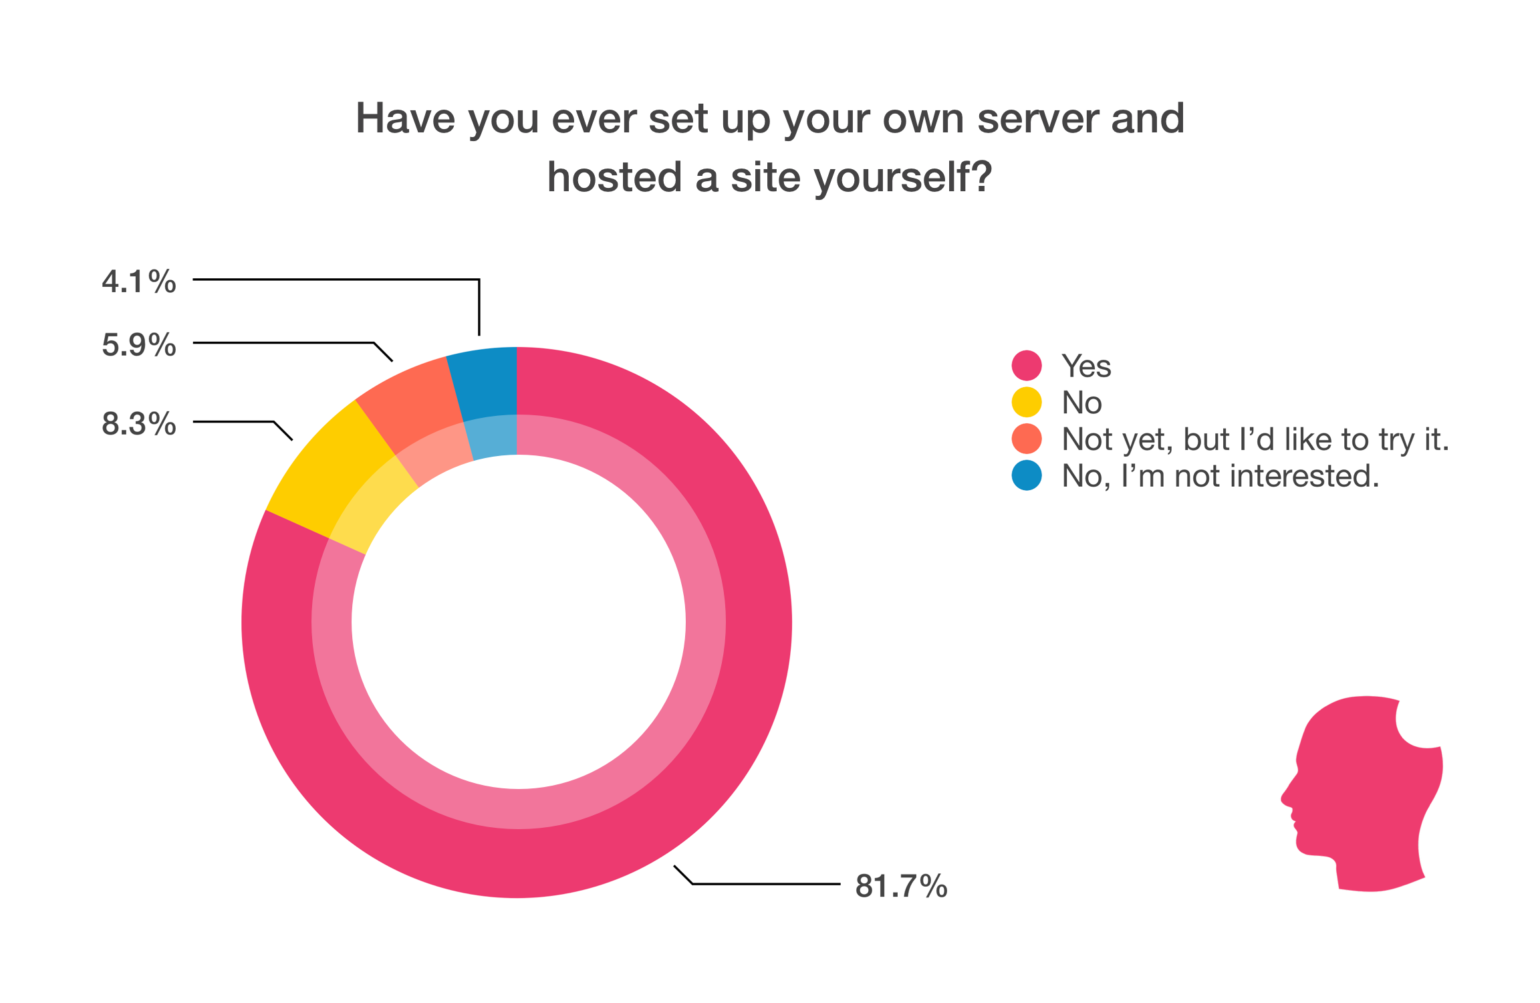
A big chunk of respondents, 81.7%, have set up their own server before. Around eighteen percent haven’t set one up, but 5.9% of those would like to try it out. (cough, cough, SpinupWP can help make this easier cough, cough).
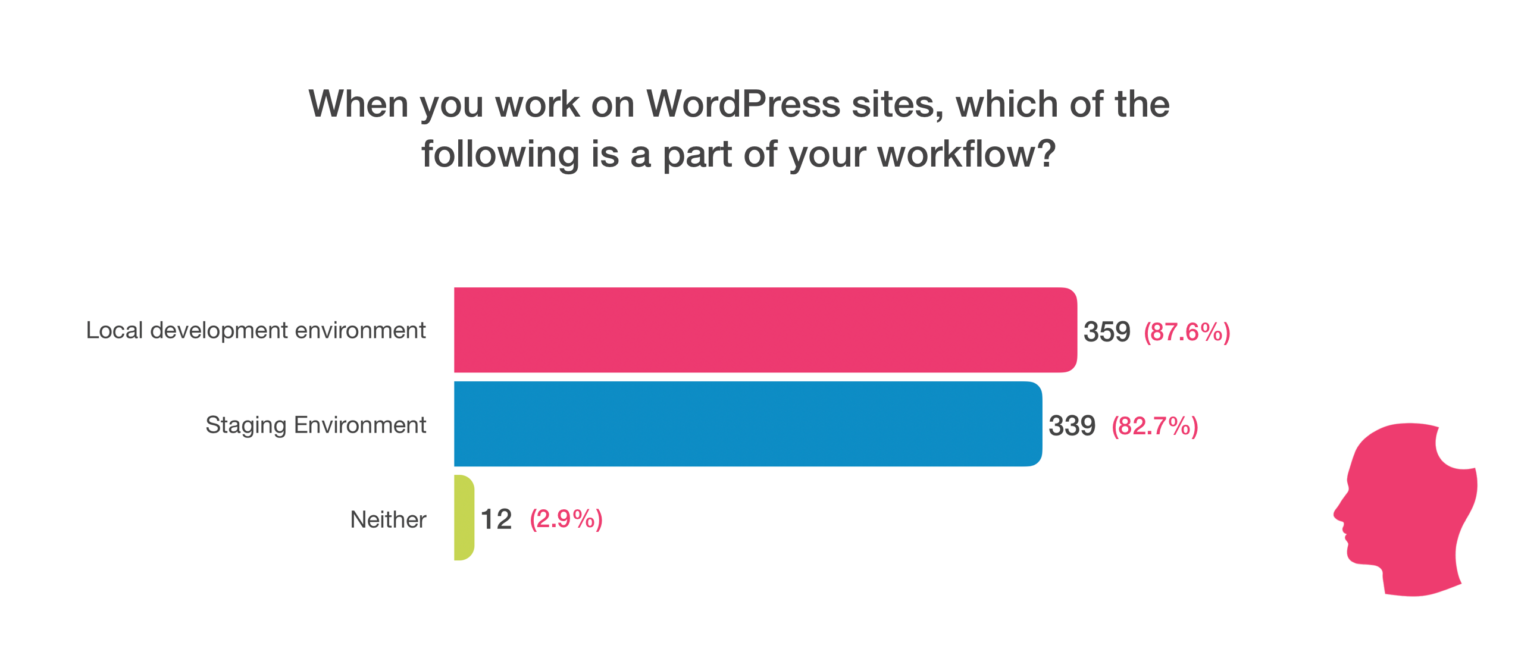
The majority of respondents (87.6%) use a local development environment as part of their workflow. A local testing server can be one of the most important tools in a web developer’s tool belt. Can’t decide which local environment to use? We compared XAMPP, MAMP, Local and DesktopServer. A staging environment is a part of 82.7% of respondents’ workflows. For 3%, they didn’t use either environment. Let’s hope they aren’t running e-commerce sites like WooCommerce 😬.
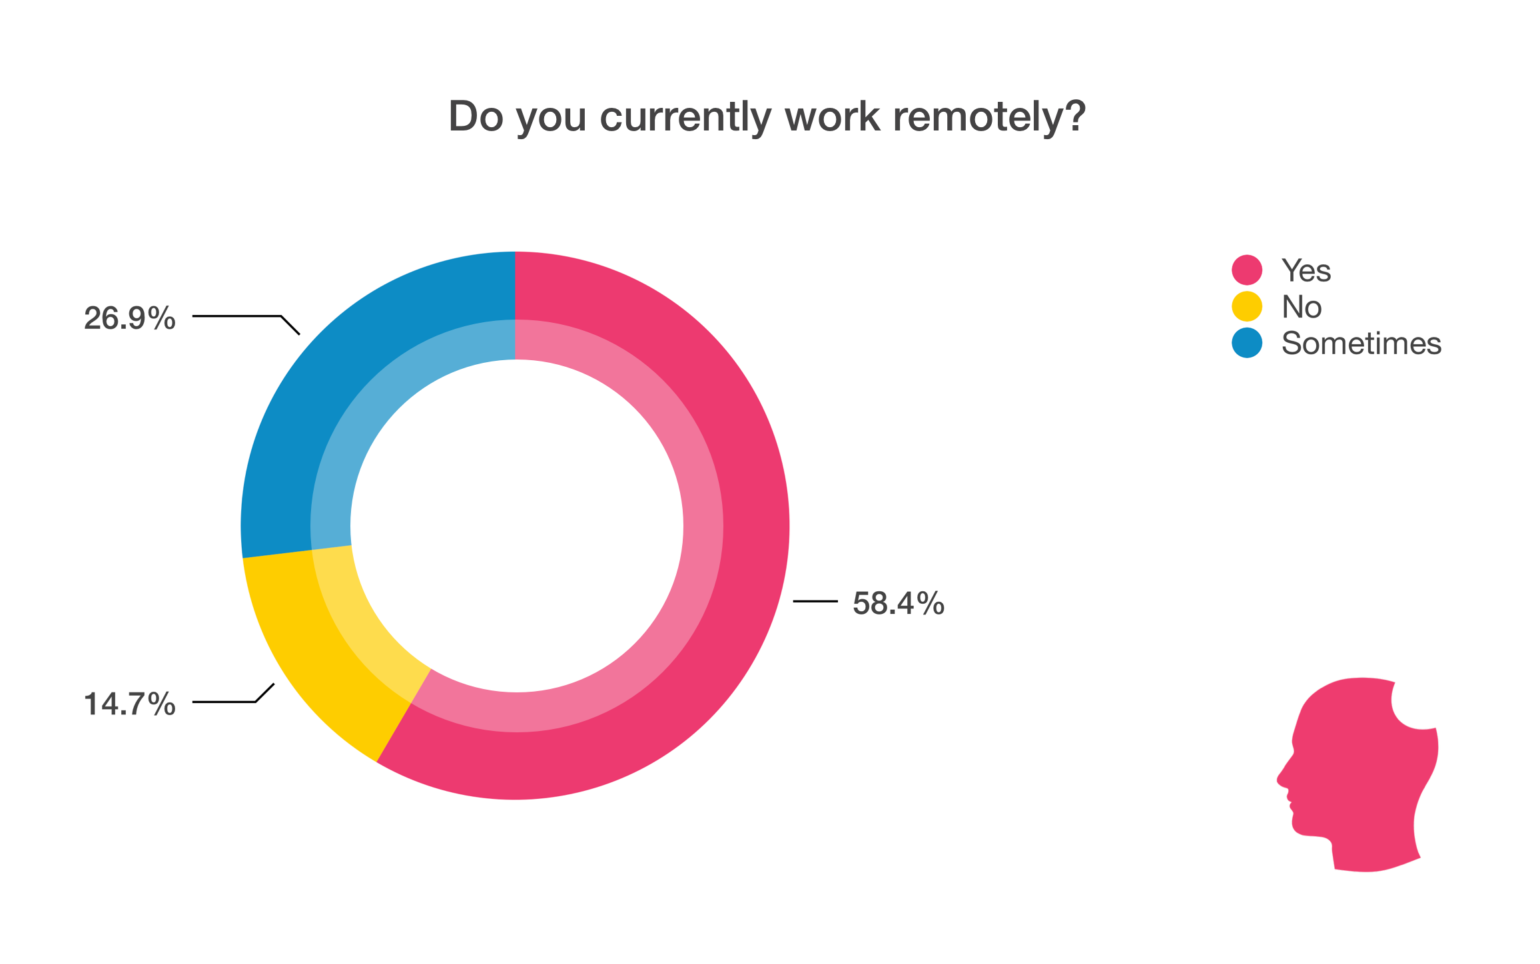
Most of our respondents (58.4%) work remotely. While some of these respondents may work for themselves, this still means quite a few companies are allowing their employees to work from home at least some of the time. Working remotely isn’t for everyone but those that appreciate it, really do. A few years back, we wrote about our struggles to stay healthy while working from home.
Education
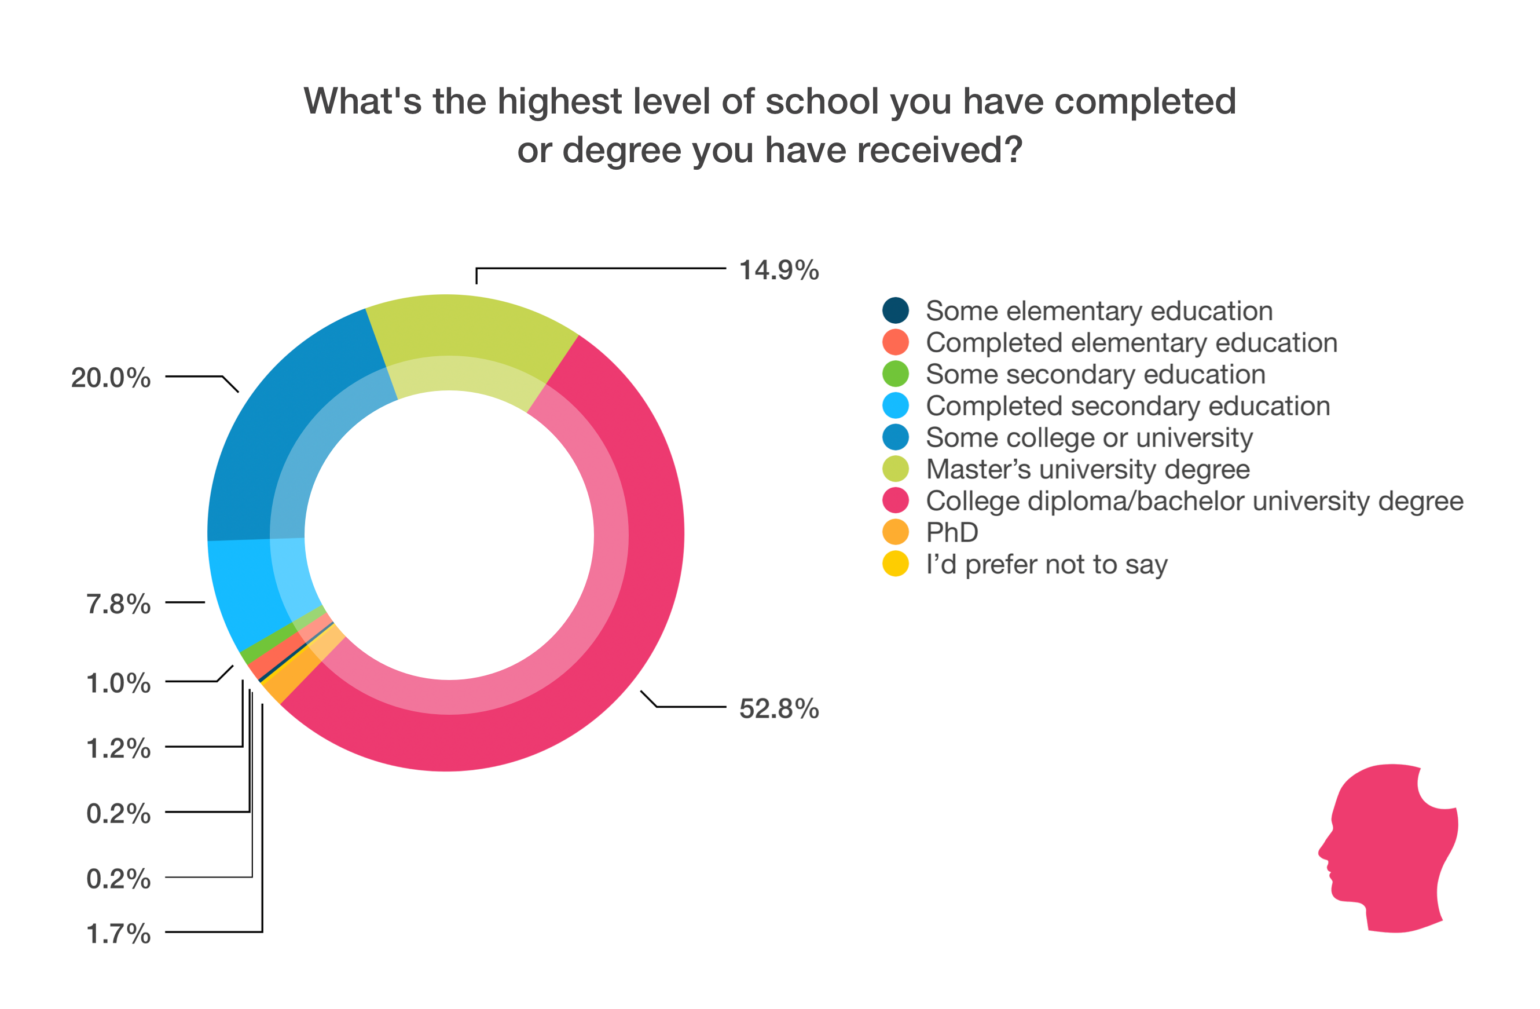
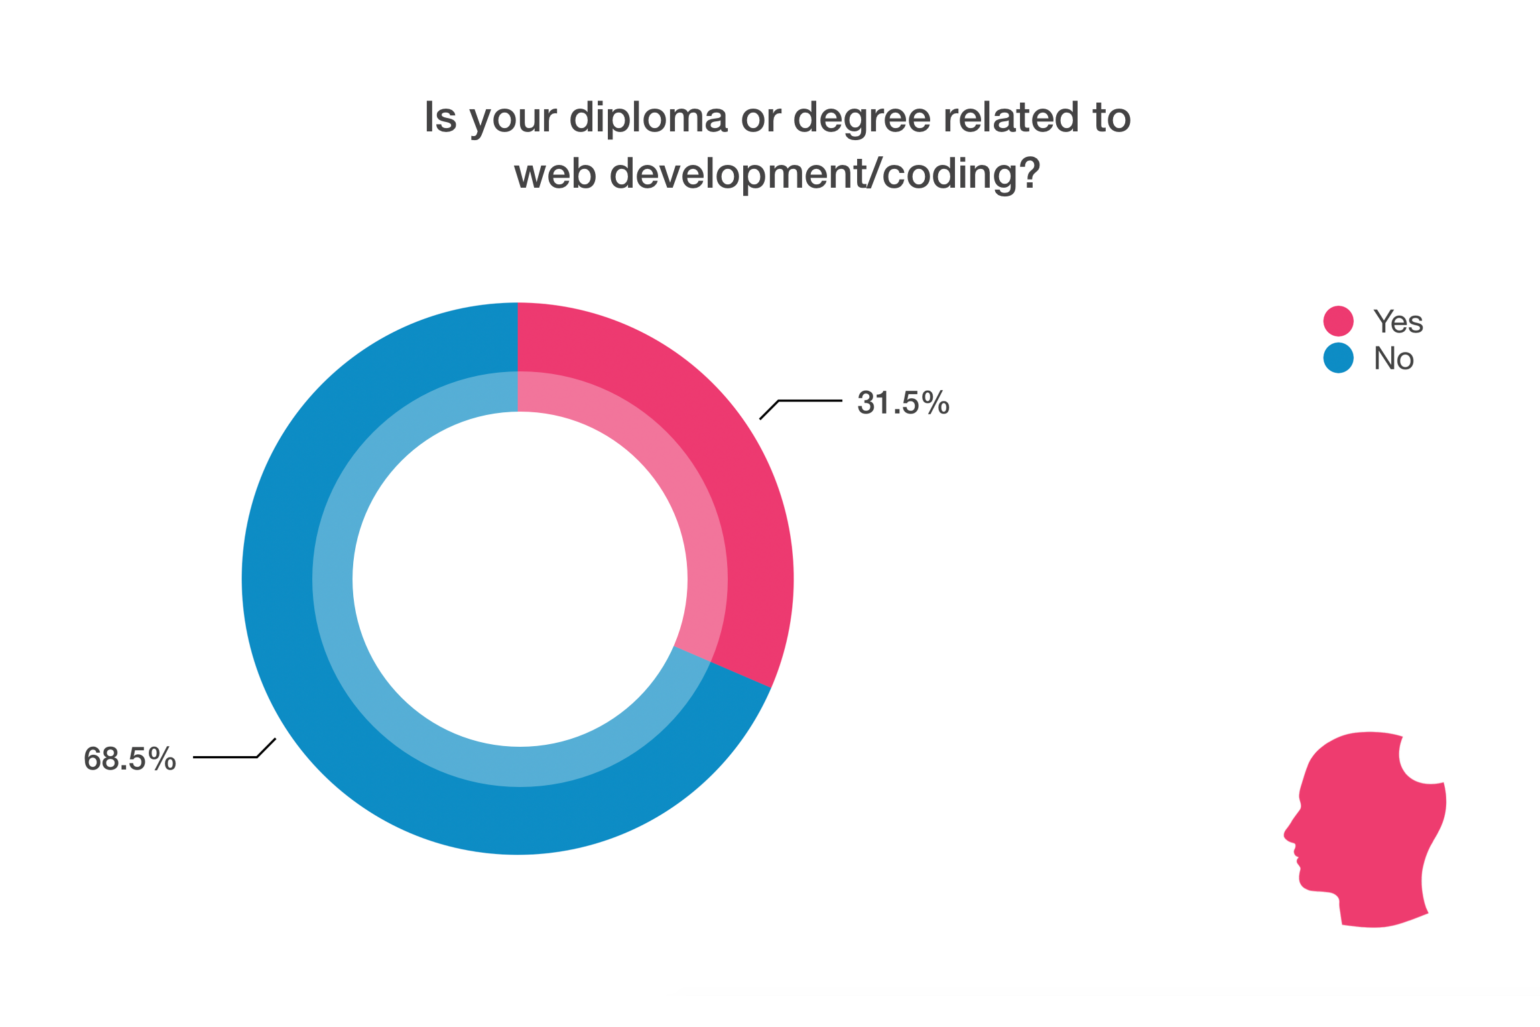
A little more than half, 52.8%, of respondents, have a college diploma or a university degree, 14.9% have a Masters and 1.7% have a PhD. Of those, only 31.5% said their degree was related to web development/coding.
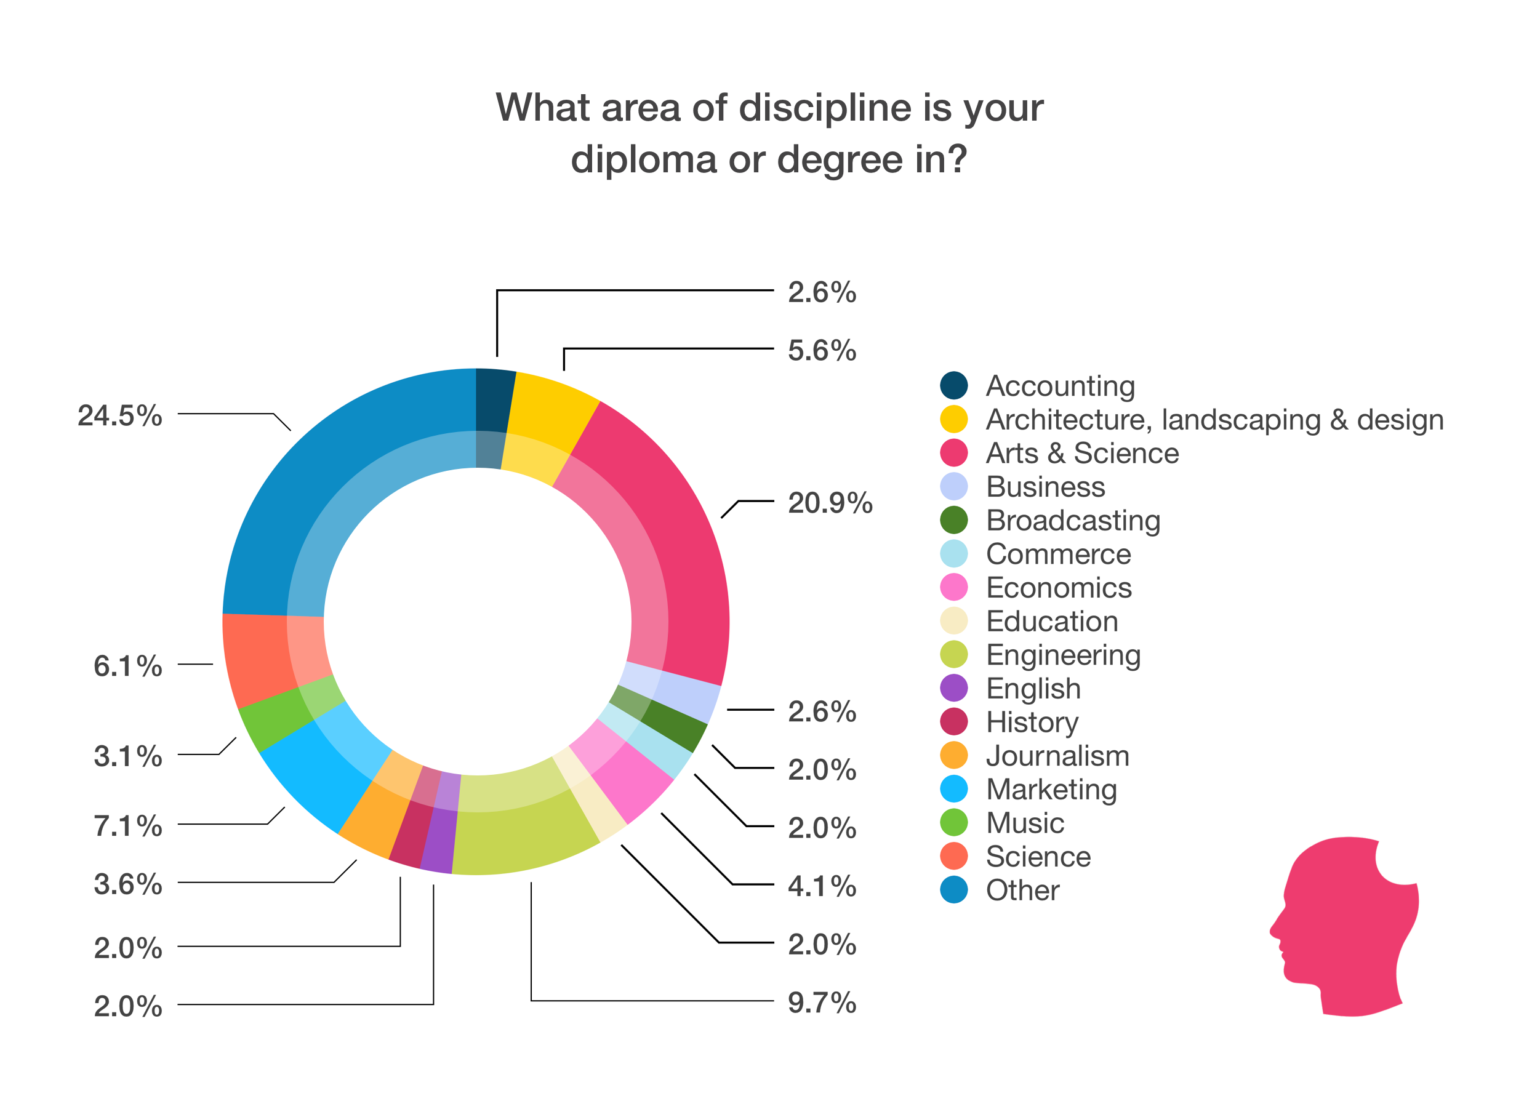
With almost a third of respondents’ first career being in the arts, it’s logical that for 20.9% of those, their diploma or degree is in the Arts & Science discipline. The next most popular area of discipline is Engineering (9.7%), which would be a fitting choice for someone looking to become a developer.
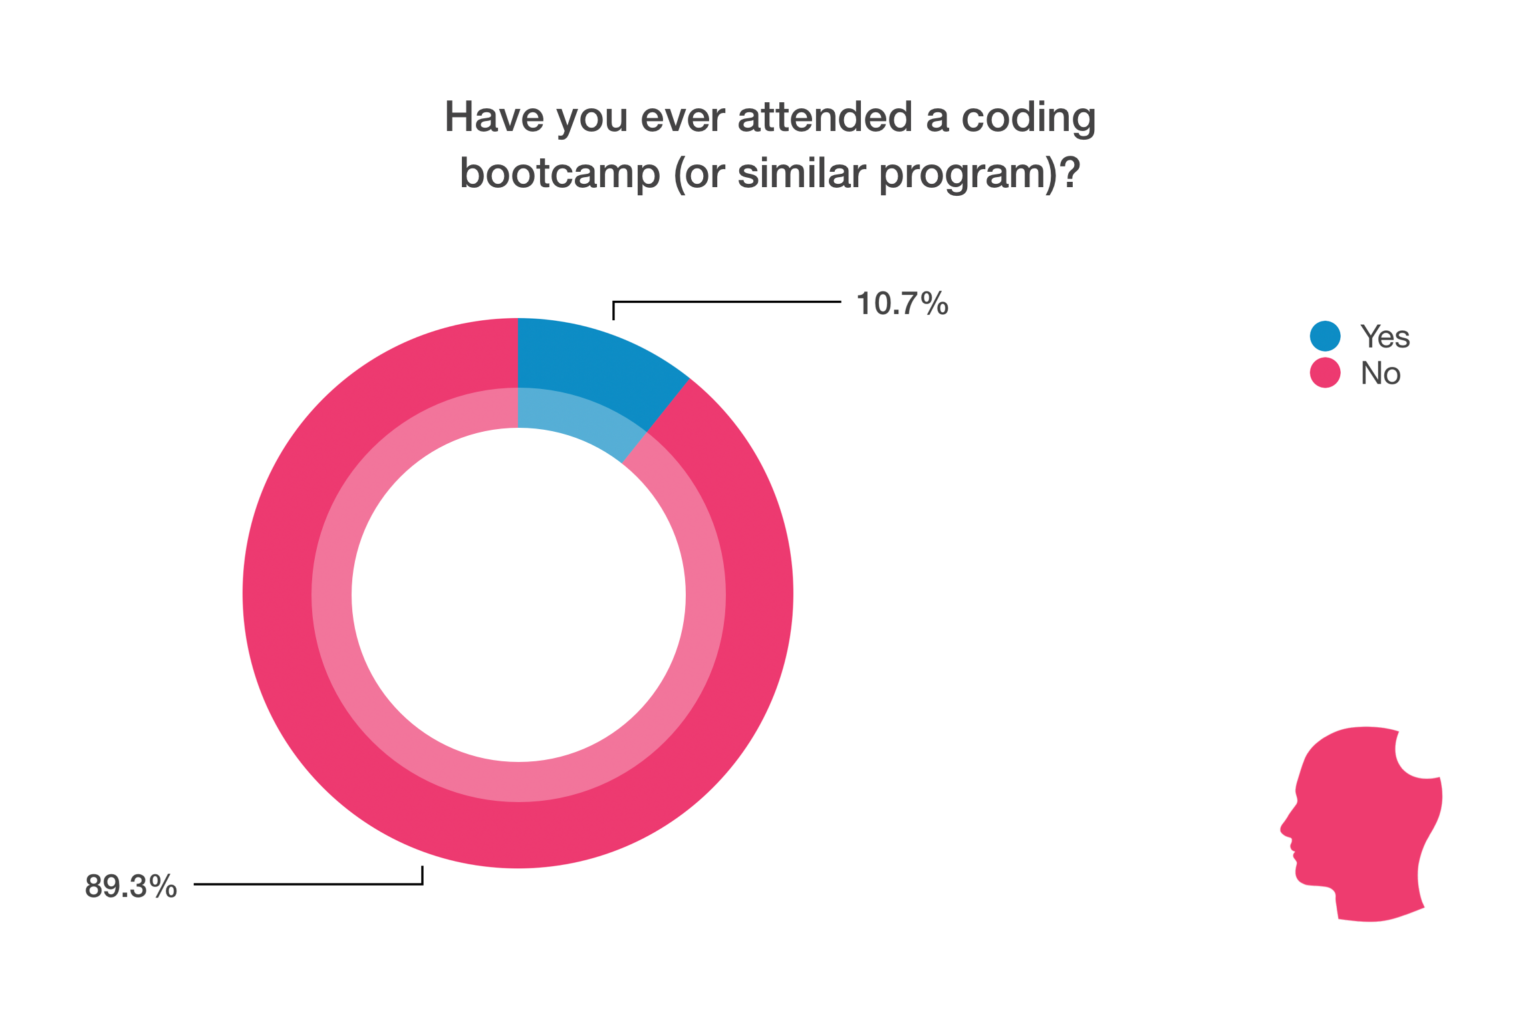
Degree or no degree, a coding bootcamp can be an option for anyone looking to learn about web development. They’re often a few months long and give you the skills you need to get hired at a company where you can continue to learn and grow. They usually require a hefty investment but give you focused in-person learning. A little over 10% of respondents have attended a bootcamp.
When we dug into the data further, we found that 93% of respondents that attended a coding bootcamp didn’t have an engineering or computer science degree and 27% of the respondents didn’t have any degree. Of respondents with an engineering or computer science degree, 2% also attended a coding bootcamp.
Income
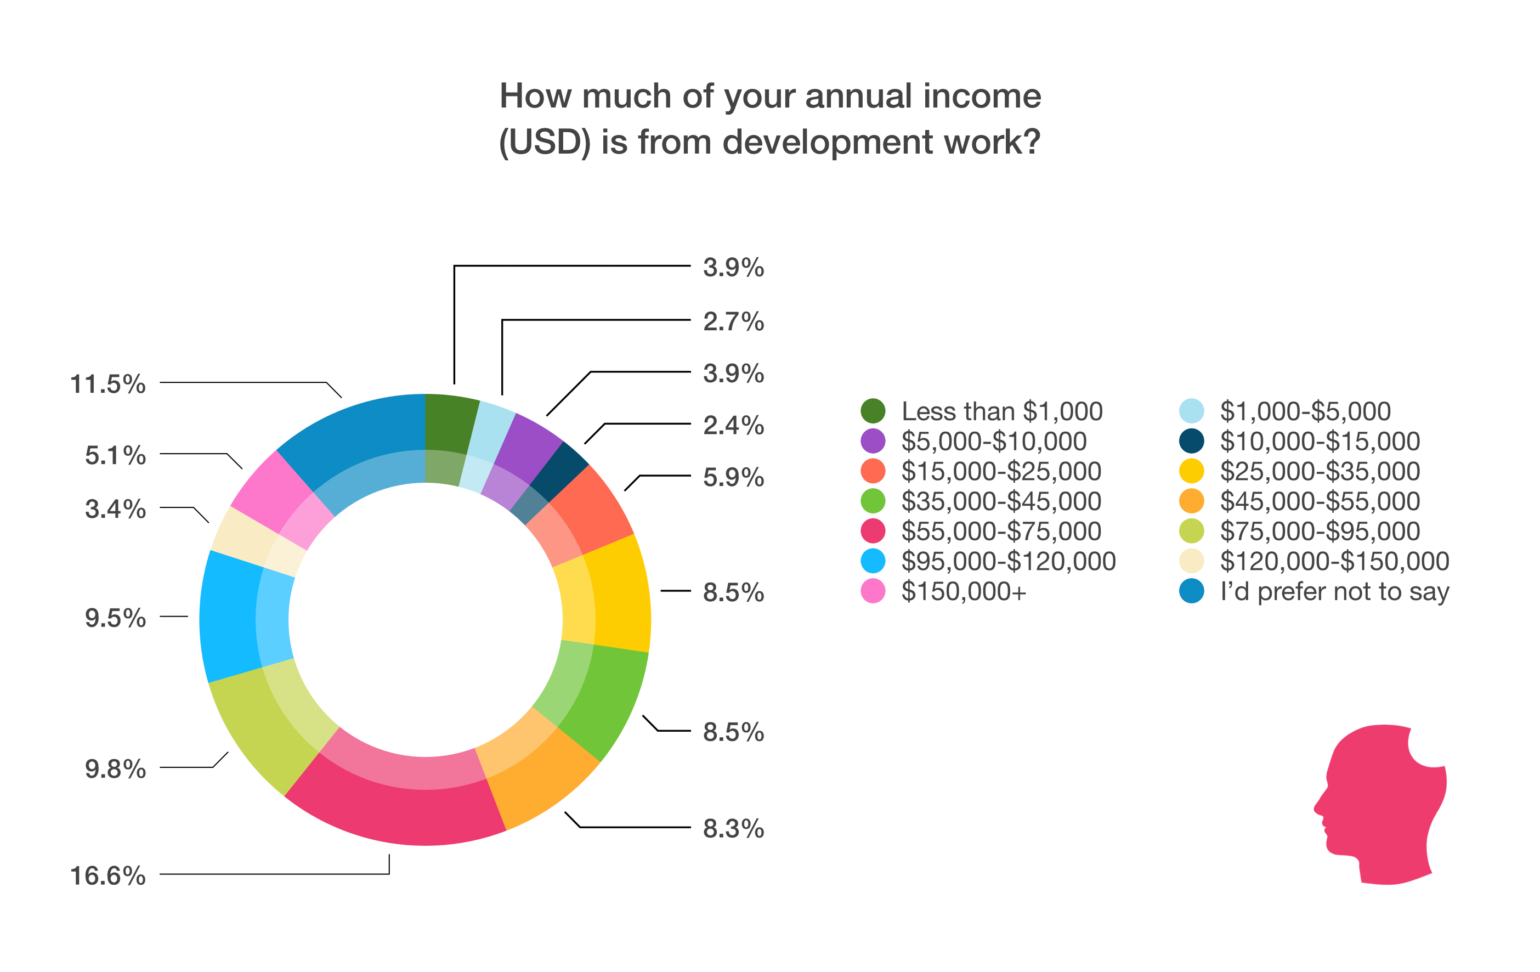
Of our respondents, 16.6% make between $55,000-$75,000 annually from web development work, which seems on track with the $61,083 average cited by Glassdoor. Ranges on either side of that are fairly evenly dispersed. Keep in mind, these numbers are coming from varying levels of experience and workloads. Some are working just for a company, some are working for a company and for themselves while others may only do web development in addition to an unrelated day job.
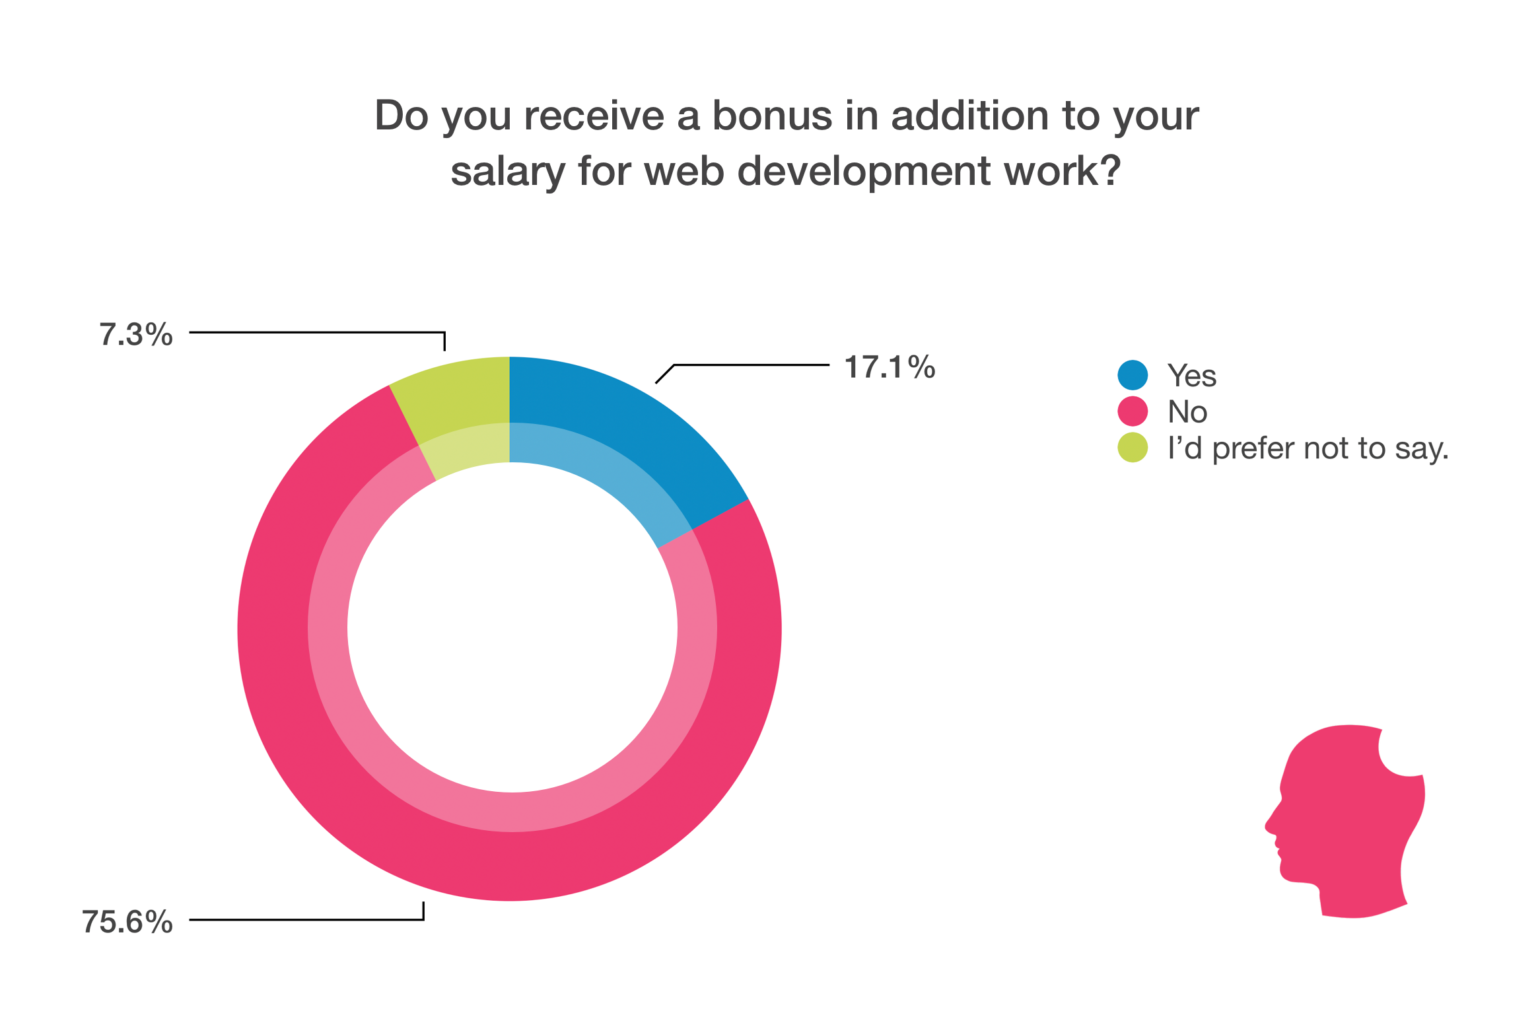
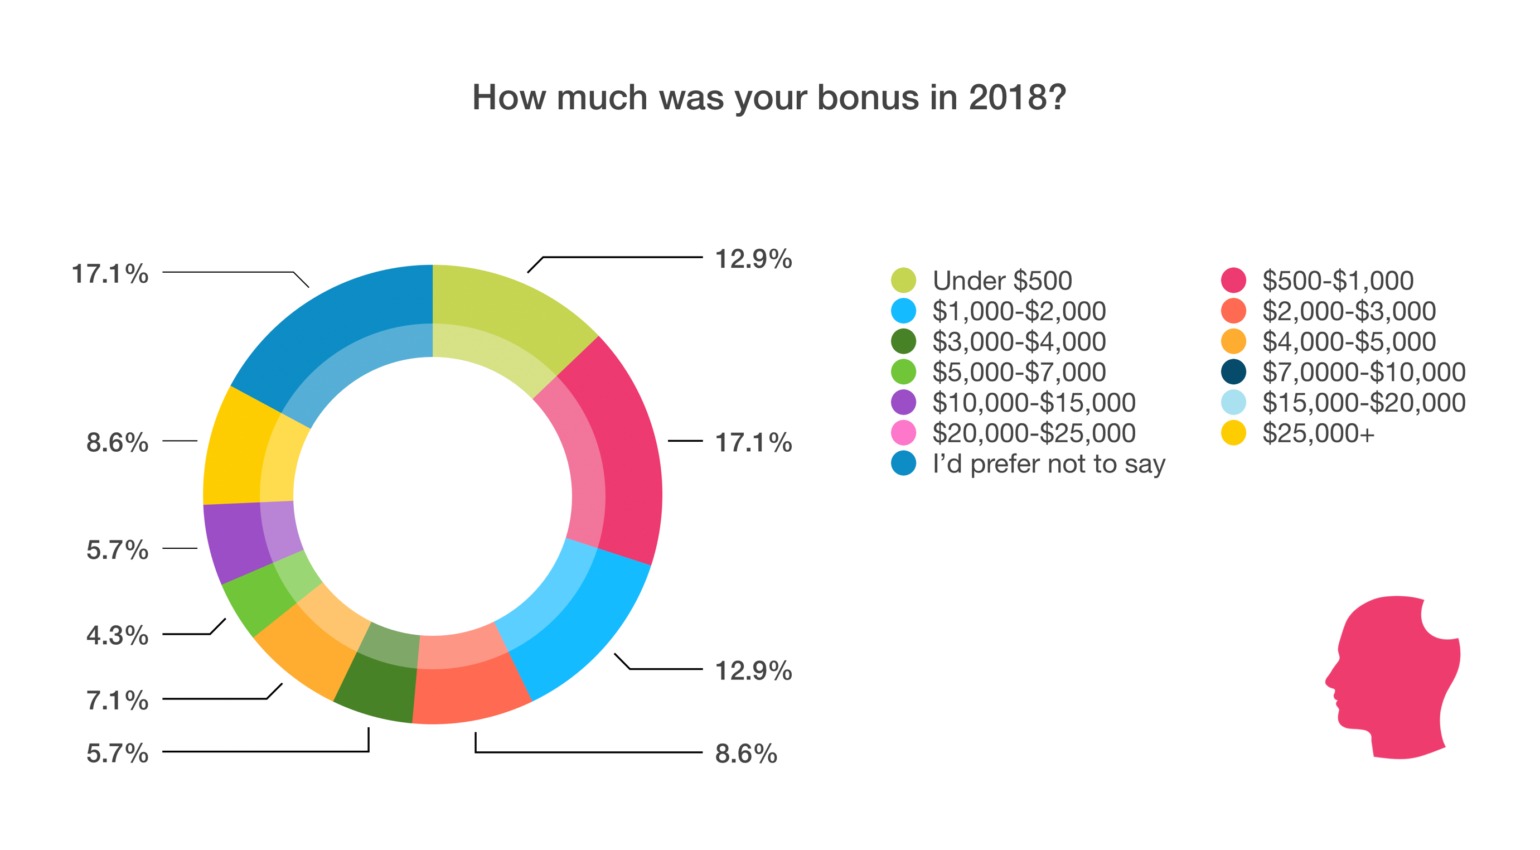
Of the 17.1% who reported getting a bonus last year, the most common bonus was between $500 and $1,000 (17.1%), followed by $1,000 to $2,000 (12.9%).
Work day
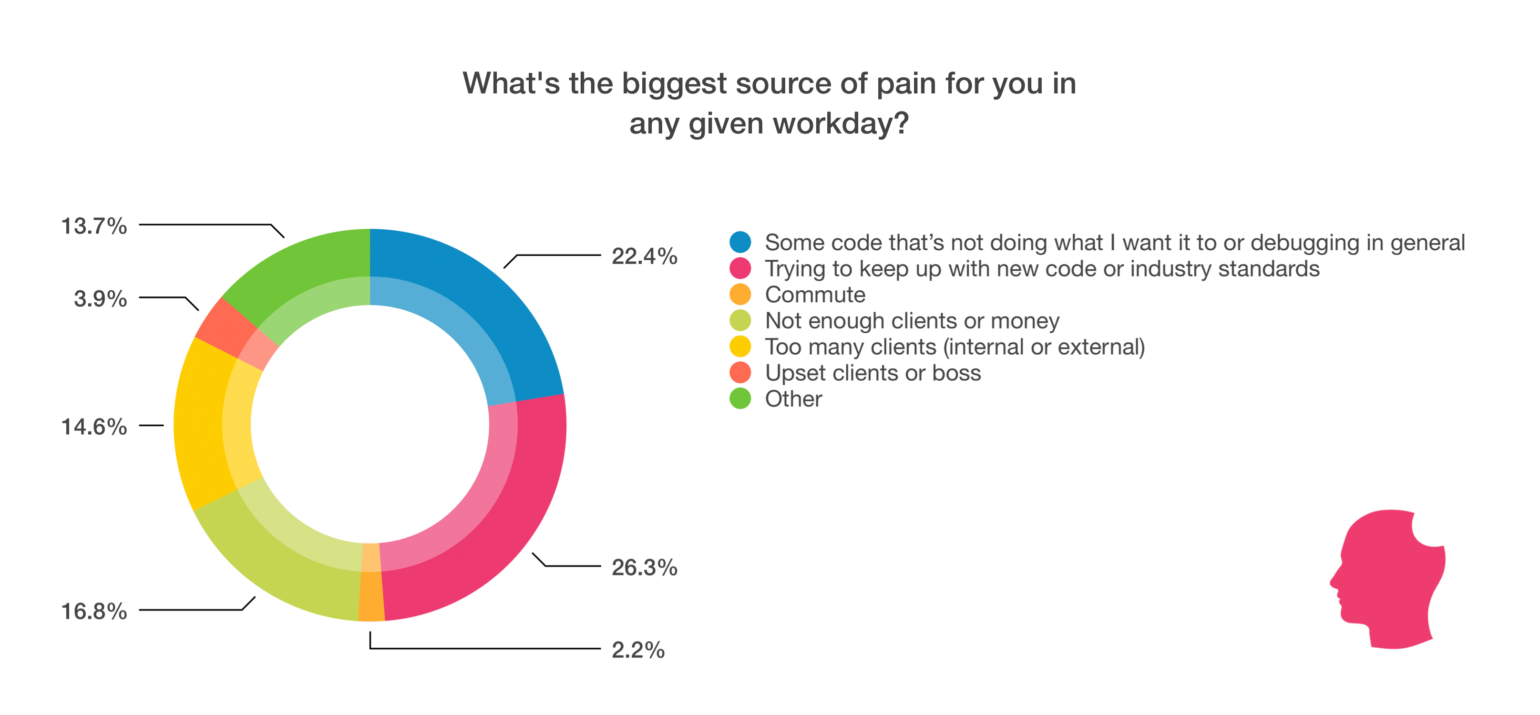
Of our respondents, 26.3% said that trying to keep up with new code or industry standard is the biggest source of pain in any given workday. Web development is always evolving and shows that what for some is an exciting part of the job, for others is a source of pain. Next up, “some code that’s not doing what I want it to or debugging in general” is the biggest source of pain for 22.4% of our respondents.

Whatever your source of frustration, know that you’re not alone. Chances are, another fellow web developer can relate.
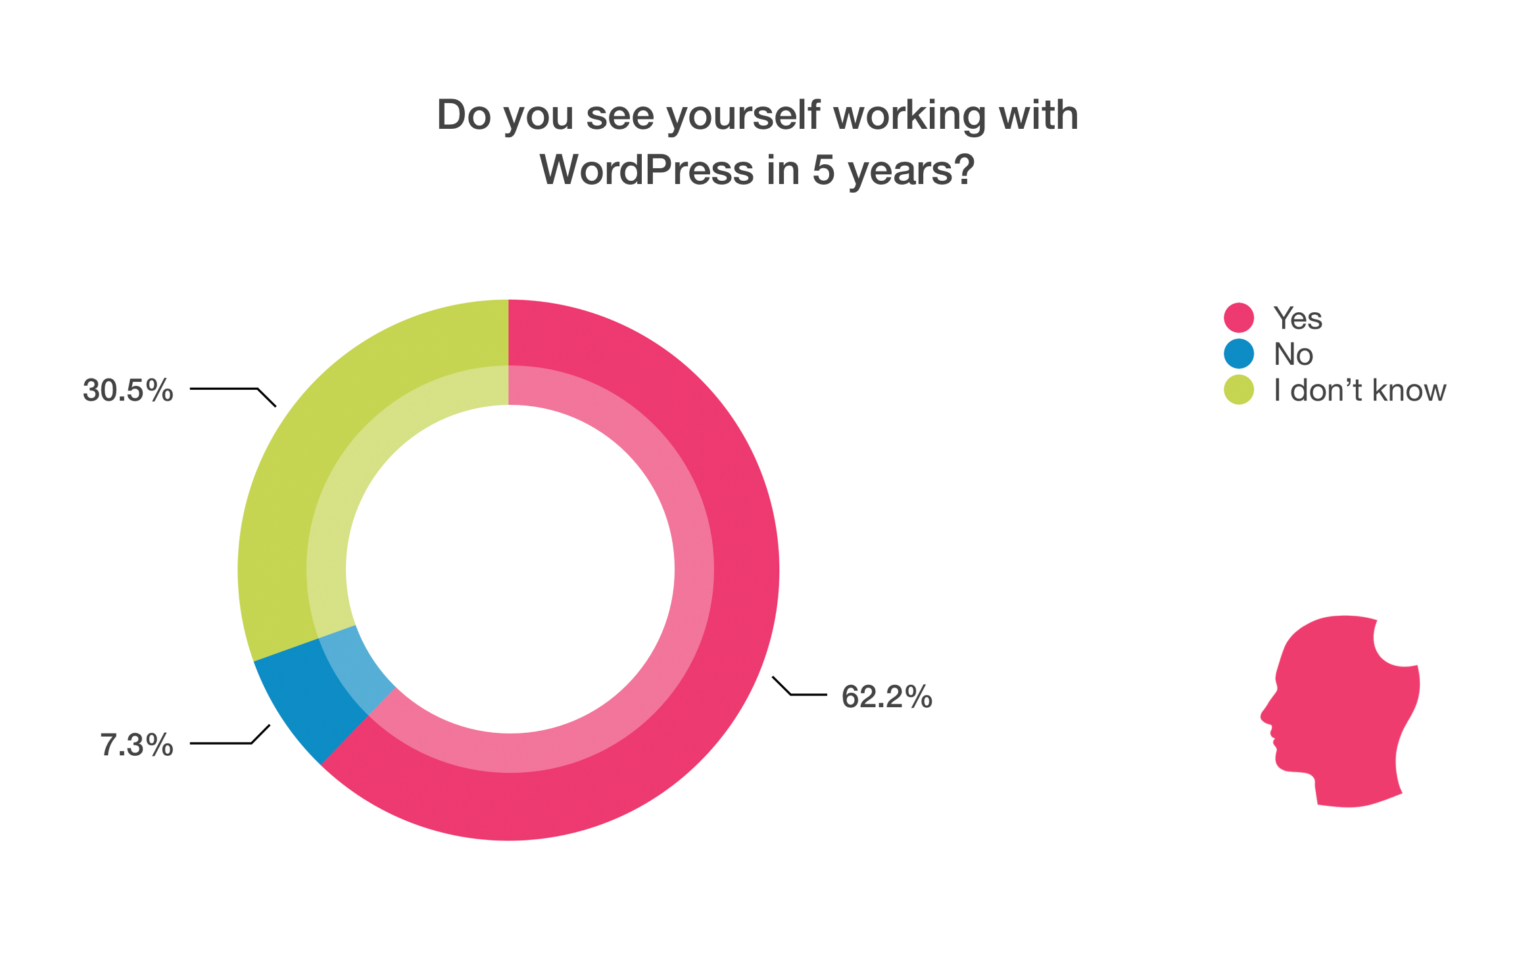
The majority of respondents, 62.2%, see themselves working in WordPress in 5 years; whereas 30.5% didn’t know. The remaining 7.3% didn’t see themselves working with WordPress in 5 years. Some didn’t like the direction WordPress was taking…
Client fatigue from option overload. Most business clients have too many SaaS products they use in their daily routine, and i’m seeing a desire from clients for simplicity, very simple page editing when it comes to updating their website.
…and others plan to focus on JavaScript.
I think JS frameworks are going to grow at an ever-increasing pace. That’s where more of my attention is focused these days.
Next time
As we sorted through the results, we realized there were a few things we could change next time to give a more in-depth report:
- Almost half our respondents (49.8%) who work for themselves have 11 or more clients. Next time, we’ll have to add further options to learn more about what the breakdown is for those working with 11+ clients. It would also be interesting to see how many clients those who are working for themselves full-time are taking on vs. those who work for a company and for themselves. It’s also possible this question wasn’t worded specifically enough and people are counting more than the number of clients they’re working with right now.
- The “what type of work makes up most of your revenue?” question for those who work for themselves should be broken up in the future. “Existing sites” can include hosting/maintenance so it’s possible some users fell into more than one category. It’d be helpful to know the type of work people are doing on existing sites.
- When asking respondents if they work remotely, it would be interesting to separate it out so we see a breakdown of those who work for a company and work remotely.
Wrapping up
Thanks to everyone who took the time to participate in our industry survey. It’s fascinating to see where others in the web development community come from and what their work life looks like.
What did you find most interesting to learn about your peers? Is there anything we missed that you’d like to know next time? Let us know in the comments.