
A few months back Iain wrote about how our team pushes each other to be better developers, which included insights into how we improve code quality using tools such as Xdebug, unit tests, and code reviews. While these tools can significantly reduce the number of bugs introduced into a codebase, they don’t always highlight more subtle issues that can cause problems further down the line, especially in regards to performance and resource utilization.
In this article I want to demonstrate a few ways in which you can identify potential performance issues in your codebase, which will hopefully allow you to fix them before they become real issues. Let’s start with Query Monitor before moving onto code profiling using Blackfire.
Query Monitor
Query Monitor is a debugging plugin by John Blackbourn and it provides a plethora of useful information about the current page request, such as:
- Page generation time and memory usage
- Database queries performed and time taken
- Slow or duplicate database queries
- HTTP requests performed using the WordPress HTTP API
- Hooks fired during the request and the actions attached to each hook
It also adds important metrics to the admin bar, so that you can quickly see page generation time, memory usage, database query time, and total database queries performed without having to open any external tools. This in my opinion is one of the easiest ways that you as a developer can ensure that the changes you are making aren’t introducing any potential performance bottlenecks.
Real World Usage
Let’s take a look at an example from the recent release of WP Offload S3 Assets 1.2, which fundamentaly changed how assets were managed. The changes were put through the usual code review process and things were looking good. Everything worked as expected and no errors were triggered, however, a quick glimpse at the admin bar highlighted a potential bottleneck.
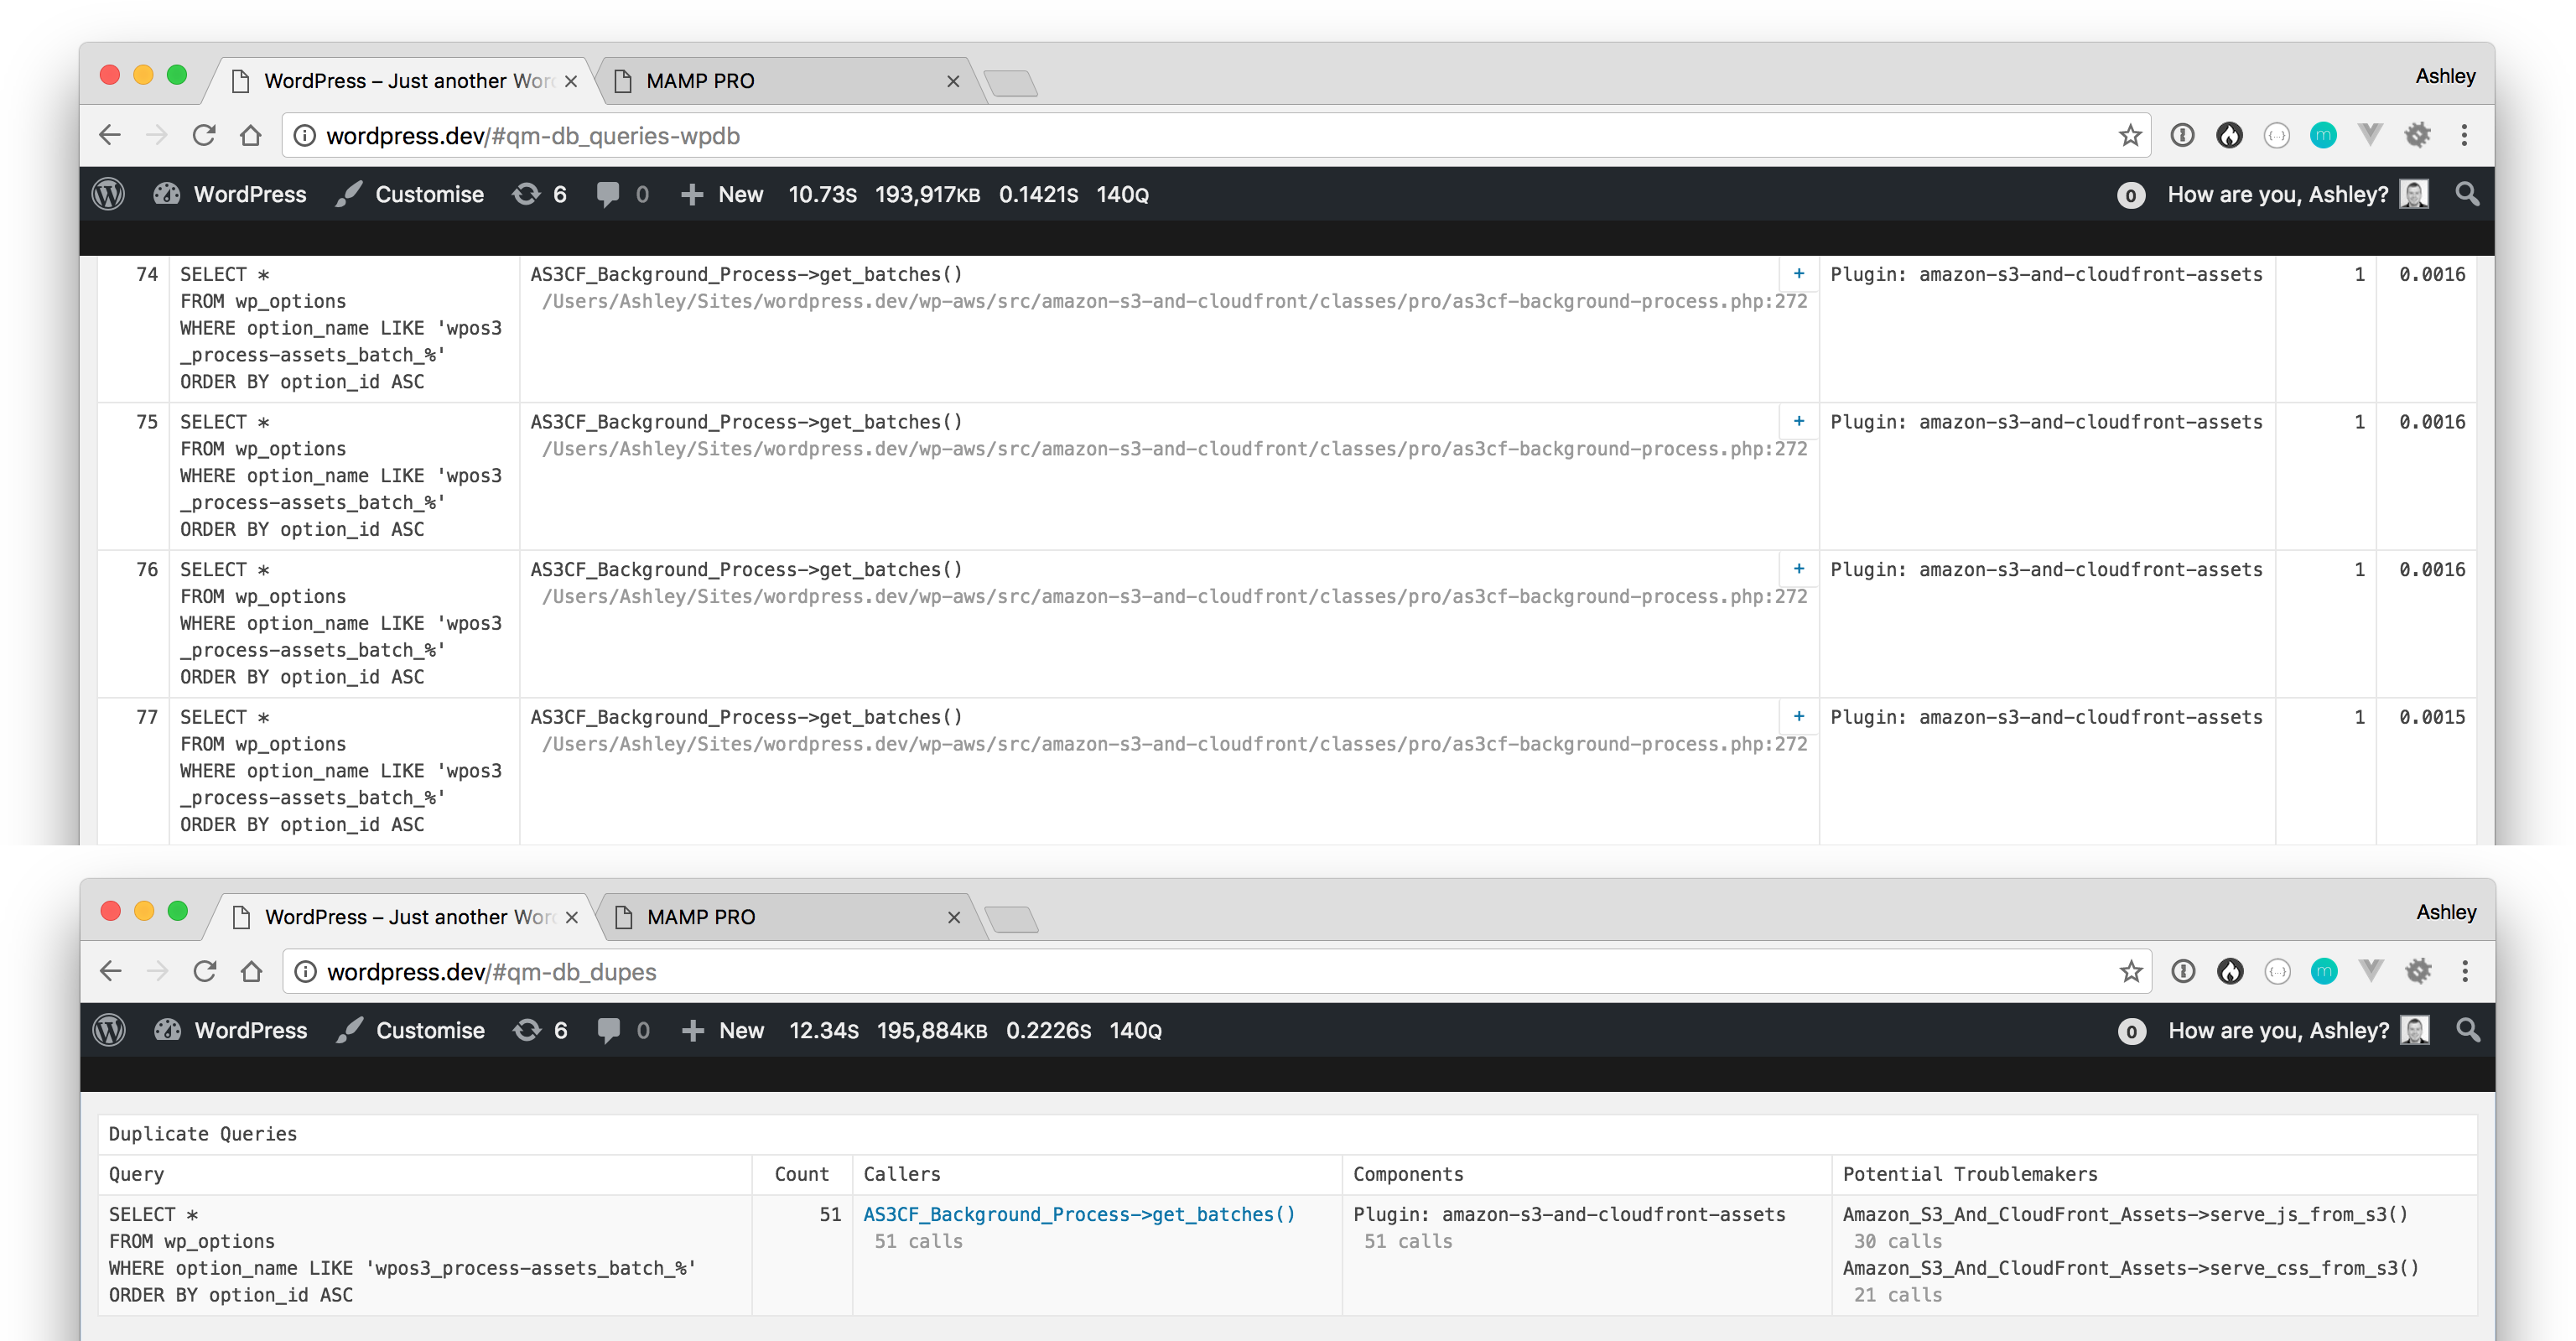
You’ll see that when changing from version 1.1.2 to 1.2 of the assets addon that the number of database queries almost doubled:

Upon opening the debug overlay you can see that there are a large amount of LIKE 'wpos3_process-assets_batch_%' queries. Query Monitor even points out that these are duplicates and that they’re all called from the get_batches method on the AS3CF_Background_Process class:
This is similar to the N+1 problem, in that for every active plugin we perform an additional LIKE 'wpos3_process-assets_batch_%' query. Although LIKE queries are generally bad they’re not slow queries in this example due to the index on the option_name column, but we should strive to reduce the number of calls to MySQL wherever possible.
The solution is simple – we need to cache the results of get_batches within the to_process method:

Beyond MySQL
Query Monitor is great for finding slow or duplicate database queries, but what if the bottleneck isn’t caused by MySQL? This is where code profiling can come in useful. Code profiling allows you to measure the frequency and duration of every function call in your application. This level of insight can be invaluable for tracking down performance bottlenecks and can be enlightening if you’re completely new to profiling.
Take the following tweet, which shows that almost 25% of the request was spent parsing smilies (for which there weren’t any). You can see that this is due to the preg_replace_callback function being called a total of 2,119 times, which is insane!
Think smilies don’t impact WordPress performance? Disable them and see for yourself. From 1.22s load time down to 971ms. #wordpress #webperf pic.twitter.com/3xGUgb4ND2
— Ashley Rich (@A5hleyRich) October 19, 2016
Blackfire
There are plenty of PHP profilers to choose from, but I’m a big fan of Blackfire, due to it’s ease of setup and user-friendly UI. Profile results are presented in a call-graph that shows the execution path of your application and gives you detailed resource consumption metrics like wall-time (real-world time), I/O time, CPU time, memory and network. Paid versions also show HTTP calls and SQL requests, and provides recommendations defined by performance experts.
Diving In
Let’s take a look at another example from the recent release of WP Offload S3 Assets 1.2. The following call-graph is fully interactive and can be explored by dragging around the cursor:
There’s a lot going on due to the complexity of WordPress, but generally, anything in the call-graph that’s pink should be investigated. In this example there are two areas of interest: mysqli_query and unserialize.
mysqli_query attributes to roughly 28% of the total wall-time, which may seem excessive, but as this is a local development machine running MAMP it’s not uncommon for MySQL to perform poorly. You can confirm that MySQL is the bottleneck by checking the I/O wait time for the mysqli_query function, which is 99.5% of its total wall-time.

unserialize only attributes to about 8% of the total wall-time, but what’s more concerning is that it’s called a total of 653 times! If you trace the execution path back up the call-graph you will see that get_files is calling get_files_by_location a total of 460 times. That doesn’t seem right!

The solution is once again simple – we need to cache the results of get_files, like we did above:

Now if we profile the code once more the results look a lot more pleasing:
Neither unserialize nor get_files_by_location appear in the call-graph (due to low wall-time), but if you search for the functions you will see that they’re called a total of 213 and 20 times respectively. That’s a pretty big improvement!
Conclusion
As you can see both Query Monitor and Blackfire are powerful tools to have in your arsenal, as they allow you to quickly check your codebase for potential bottlenecks, with little to no effort. Although the optimizations I’ve demonstrated in this article may seem trivial they can have a profound impact on high traffic sites, or, those where page caching isn’t an option.
When developing I always ensure Query Monitor is enabled as it allows me to see at a glance if the changes I’ve introduced have impacted load time, or increased the amount of database queries. However, performing a full blown code profile isn’t required on every change, but they’re certainly worth doing when any of the following criteria are met:
- Large code changes
- Loops over large datasets or nested loops
- Use of
preg_functions or when processing large strings - Use of recursion
- Introduction of API calls (to ensure the responses are cached appropriately)
The tools shown here aren’t the only available options; Debug Bar and Xdebug Profiler are popular alternatives. Do you profile your code? If so, what tools do you use? Let us know in the comments below.